
12 Oct Real Estate Market September 2023
Your September 2023 real estate market update is here! Covering Toronto, Oakville, Burlington, Hamilton and the surrounding areas.
Highlights of the real estate market from TREBB and RAHB
The impact of high borrowing costs, high inflation, uncertainty surrounding future Bank of Canada decisions and slower economic growth continued to weigh on Greater Toronto Area (GTA) home sales in September. However, despite the market being better-supplied with listings, the average selling price was up year-over-year.
“The short and medium-term outlooks for the GTA housing market are very different. In the short term, the consensus view is that borrowing costs will remain elevated until mid-2024, after which they will start to trend lower. This suggests that we should start to see a marked uptick in demand for ownership housing in the second half of next year, as lower rates and record population growth spur an increase in buyers,” said TRREB President Paul Baron.
REALTORS® reported 4,642 home sales through TRREB’s MLS® System in September 2023 – down 7.1% compared to September 2022. The year-over-year dip in sales was more pronounced for ground-oriented homes, particularly semi-detached houses and townhouses. On a month-over-month seasonally-adjusted basis, sales were also down slightly. New listings were up strongly on a year-over-year basis from the extremely low level in September 2022. The number of listings also trended upward on a month-over-month seasonally adjusted basis.
The MLS® Home Price Index (HPI) Composite benchmark was up by 2.4% year-over-year. The average selling price was up by 3% over the same time period. On a month-over-month seasonally-adjusted basis, both the average selling price and the MLS® HPI Composite benchmark edged lower by less than one per cent.
“GTA home selling prices remain above the trough experienced early in the first quarter of 2023. However, we did experience more balanced market in the summer and early fall, with listings increasing noticeably relative to sales. This suggests that some buyers may benefit from more negotiating power, at least in the short term. This could help offset the impact of high borrowing costs,” said TRREB Chief Market Analyst Jason Mercer.
Over in Hamilton, the REALTORS® Association of Hamilton-Burlington (RAHB) reported 620 home sales in September, the slowest level of activity seen for this month since 2010. The 18% decline in sales was met with a surge in new listings. The combined impact of lower sales and higher new listings caused the sales-to-new listings ratio to fall to 30%. There was a 19% gain in inventory, which is 12% higher than last year.
“Increases in lending rates have prompted prospective buyers to delay purchasing decisions. Lending rates may have sparked anxiety among existing homeowners, motivating them to list their properties. A surge in new listings, relative to sales, has led to a pronounced rise in overall inventory levels,” says Nicolas von Bredow, RAHB
President.
Inventory levels rose across all property types and price ranges. The sudden shift, coupled with easing sales, caused the months of supply to grow to nearly five months in September. This is up almost two whole months compared to August. In September, the unadjusted benchmark price fell to $854,200, a monthly decline of
one per cent. Despite the monthly decrease, levels remain higher than the $838,300 reported last September and the $581,500 reported pre-pandemic.
Questions about buying or selling? Reach out anytime, I’d be happy to discuss the market with you!
All the latest home prices and statistics by property type and city below!
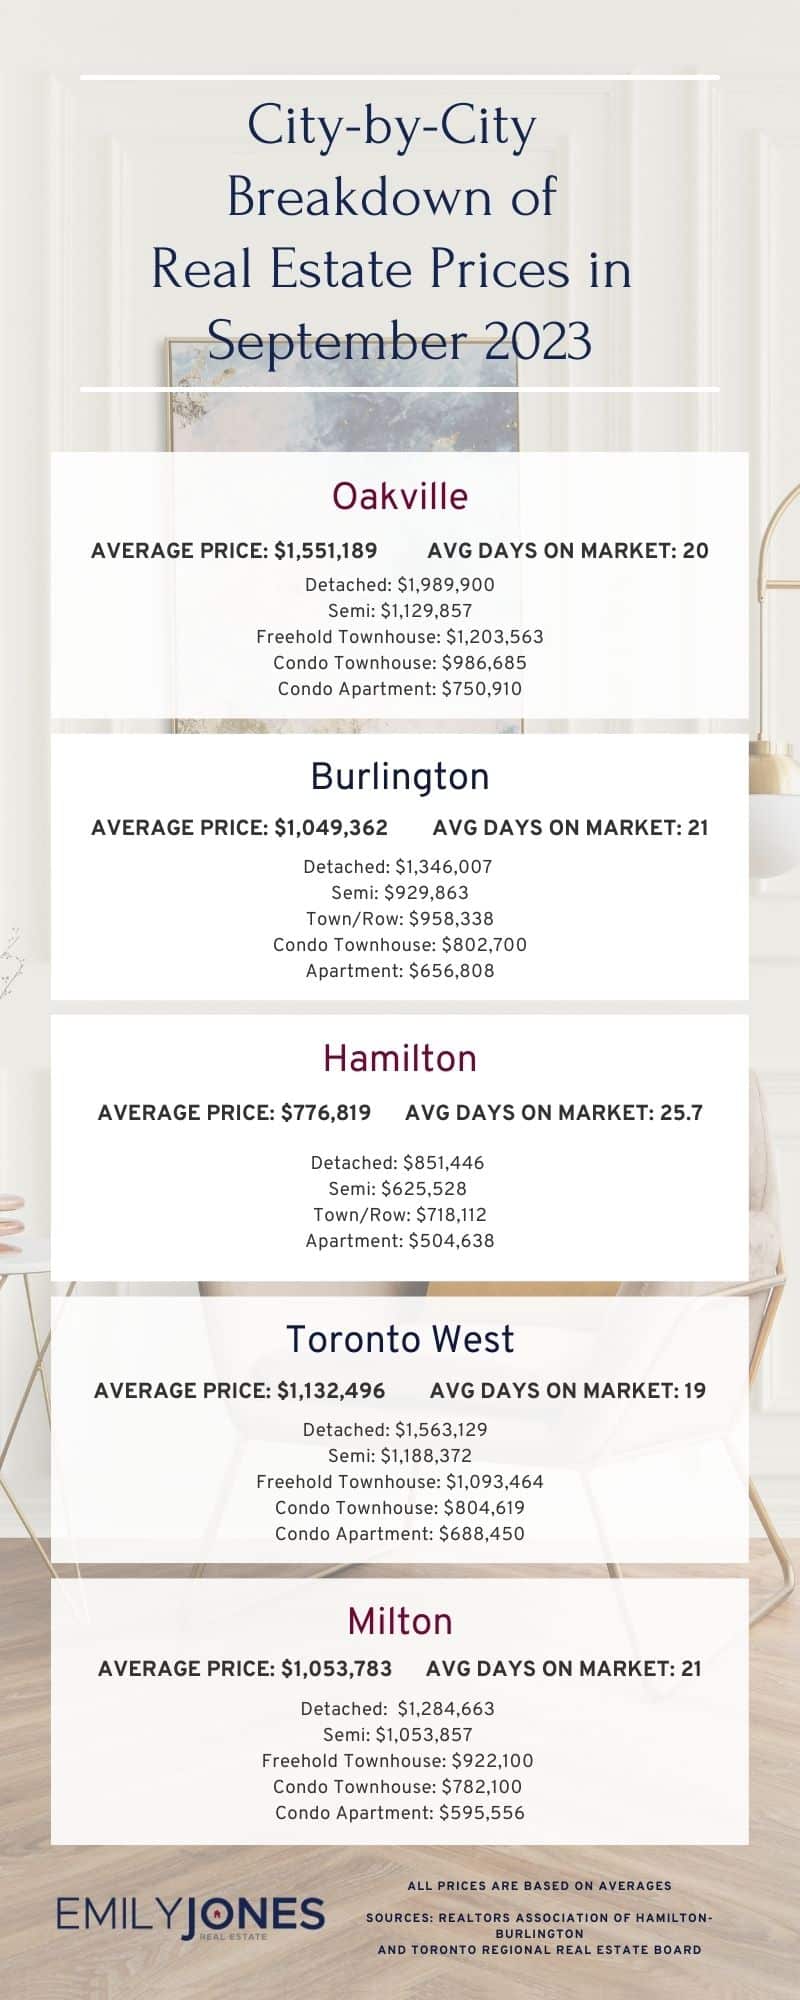
Burlington
Average Sale Price: $1,049,362 compared to $1,075,897 last month
Average Days on Market: 21 days
Detached: $1,346,007 (vs August 2023 $1,406,473)
Semi: $929,863 (vs August 2023 $965,714)
Town/Row: $958,338 (vs August 2023 $993,941)
Condo Townhouse: $802,700 (vs August 2023 $804,411)
Apartment: $656,808 (vs August 2023 $668,446)
Hamilton
Average Sale Price: $776,819 compared to $798,786 last month
Average Days on Market: 25.7 days
Detached: $851,446 (vs August 2023 $886,364)
Semi: $625,528 (vs. August $686,476)
Town/Row: $718,112 (vs August 2023 $710,201)
Apartment: $504,638 (vs August 2023 $482,495)
Oakville
Average Sale Price: $1,551,189 compared to $1,492,687 last month
Average Days on Market: 20 days
Detached: $1,989,900 (vs August 2023 $1,989,978)
Semi: $1,129,857 (vs August 2023 $1,167,500)
Freehold Townhouse: $1,203,563 (vs August 2023 $1,265,475)
Condo Townhouse: $986,685 (vs August 2023 $1,013,915)
Condo Apartment: $750,910 (vs August 2023 $824,568)
Mississauga
Average Sale Price: $1,021,324 compared to $1,057,232 last month
Overall Average Days on Market: 20 days
Detached: $1,439,735 (vs August 2023 $1,563,717)
Semi: $1,084,793 (vs August 2023 $1,046,247)
Freehold Townhouse: $1,093,700 (vs August 2023 $956,770)
Condo Townhouse: $796,440 (vs August 2023 $855,061)
Condo Apartment: $652,653 (vs August 2023 $629,894)
Toronto West
Average Sale Price: $1,132,496 compared to $993,866 last month
Average Days on Market: 19 days
Detached: $1,563,129 (vs August 2023 $1,465,197)
Semi: $1,188,372 (vs August 2023 $1,064,727)
Freehold Townhouse: $1,093,464 (vs August 2023 $1,136,100)
Condo Townhouse: $804,619 (vs August 2023 $836,235)
Condo Apartment: $688,450 (vs August 2023 $703,516)
Milton
Average Sale Price: $1,053,783 compared to $1,083,812 last month
Average Days on Market: 21 days
Detached: $1,284,663 (vs August 2023 $1,350,202)
Semi: $1,053,857 (vs August 2023 $1,053,375)
Freehold Townhouse: $922,100 (vs August 2023 $969,291)
Condo Townhouse: $782,100 (vs August 2023 $788,613)
Condo Apartment: $595,556 (vs August 2023 $635,406)
Sources for Real Estate Market Update for September 2023 : Toronto Regional Real Estate Board and REALTORS® Association of Hamilton-Burlington