
06 Oct Real Estate Market September 2022
The Greater Toronto Area (GTA) housing market continued its adjustment to higher borrowing costs in September 2022. Sales for the month were down by 44.1% compared to September 2021. New listings were also down on a year-over-year basis by 16.7%. This was the lowest number of new listings reported for the month of September since 2002. This is especially troublesome given that the stock of homes in the GTA increased markedly over the last 20 years.
On a year-over-year basis, the average price dipped by 4.3% to $1,086,762. The average price was up compared to August 2022 when it was $1,079,500.
Hovering just below $1.1 million, the average selling price may have found some support during the last couple months of summer. With new listings down quite substantially year-over-year and well-below historic norms, some home buyers are quite possibly experiencing tighter market conditions in some GTA neighbourhoods. October generally represents the peak of the fall market, so it will be important to see where price trends head over the next month, said TRREB Chief Market Analyst Jason Mercer.
Over in the Hamilton region, The REALTORS® Association of Hamilton-Burlington (RAHB) the lowest number of September sales in over a decade. While inventories are more than double the levels recorded last year, they remain lower than levels seen prior to the pandemic. The most significant gains in inventory occurred from homes priced above $800,000.
The adjustment in both sales and inventories did cause the months of supply to push over three months, out of sellers market territory. In September, the benchmark price eased to $790,800, slightly lower than last month’s and last year’s levels. As the market adjusts away from the extreme seller’s market conditions, there will likely be further downward pressure placed on prices erasing some of the gains seen this year. However, given the still relatively low inventory levels, especially for lower priced detached homes, it is unlikely that we will see a full reversal of all the price gains that occurred throughout the past several years.
For a closer look at the numbers and a city-by-city breakdown by property type, take a look below:
Questions about buying or selling? Reach out anytime, I’d be happy to discuss the market with you!
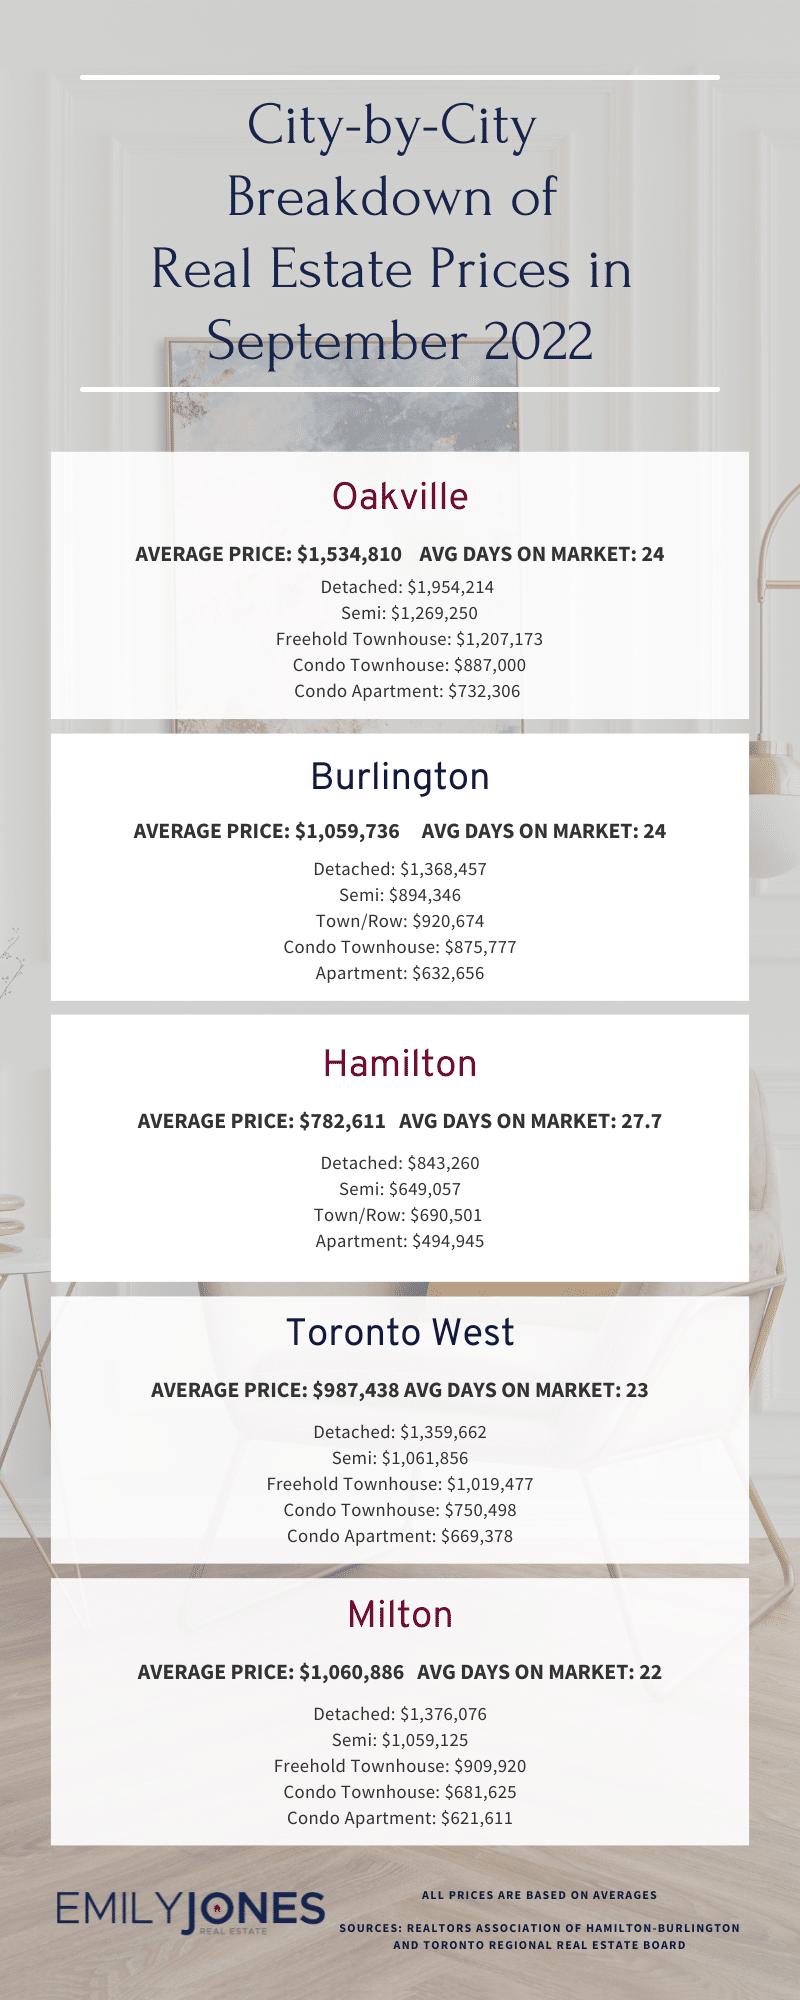
Burlington
Average Sale Price: $1,059,736 compared to $1,070,005 last month
Average Days on Market: 24 days
Detached: $1,368,457 (vs Aug 2022 $1,326,922)
Semi: $894,346 (vs Aug 2022 $959,263 )
Town/Row: $920,674 (vs Aug 2022 $968,656)
Condo Townhouse: $875,777 (vs Aug 2022 $814,056)
Apartment: $632,656 (vs Aug 2022 $663,158)
Hamilton
Average Sale Price: $782,611 compared to $792,767 last month
Average Days on Market: 27.7 days
Detached: $843,260 (vs Aug 2022 $876,899)
Semi: $649,057
Town/Row: $690,501
Apartment: $494,945 (vs Aug 2022 $465,064)
Oakville
Average Sale Price: $1,534,810 compared to $1,587,619 last month
Average Days on Market: 24 days
Detached: $1,954,214 (vs Aug 2022 $2,163,399)
Semi: $1,269,250 (vs Aug 2022 $1,209,013)
Freehold Townhouse: $1,207,173 (vs Aug 2022 $1,148,191)
Condo Townhouse: $887,000 (vs Aug 2022 $778,143)
Condo Apartment: $732,306 (vs Aug 2022 $1,011,520)
Mississauga
Average Sale Price: $1,032,889 compared to $1,077,092 last month
Overall Average Days on Market: 25 days
Detached: $1,440,490 (vs Aug 2022 $1,521,265)
Semi: $998,134 (vs Aug 2022 $989,240)
Freehold Townhouse: $963,571 (vs Aug 2022 $1,067,088)
Condo Townhouse: $817,317 (vs Aug 2022 $821,968)
Condo Apartment: $638,382 (vs Aug 2022 $612,804)
Toronto West
Average Sale Price: $987,438 compared to $960,677 last month
Average Days on Market: 23 days
Detached: $1,359,662 (vs Aug 2022 $1,364,437)
Semi: $1,061,856 (vs Aug 2022 $1,010,853)
Freehold Townhouse: $1,019,477 (vs Aug 2022 $1,061,887)
Condo Townhouse: $750,498 (vs Aug 2022 $757,995)
Condo Apartment: $669,378 (vs Aug 2022 $652,574)
Milton
Average Sale Price: $1,060,886 compared to $1,002,514 last month
Average Days on Market: 22 days
Detached: $1,376,076 (vs Aug 2022 $1,232,179)
Semi: $1,059,125 (vs Aug 2022 $997,238)
Freehold Townhouse: $909,920 (vs Aug 2022 $885,178)
Condo Townhouse: $681,625 (vs Aug 2022 $729,400)
Condo Apartment: $621,611 (vs Aug 2022 $621,400)
Sources for Real Estate Market Update for September 2022 : Toronto Regional Real Estate Board and REALTORS® Association of Hamilton-Burlington