13 Nov Real Estate Market October 2024
Your October 2024 real estate market update is here! Covering Toronto, Oakville, Burlington, Hamilton and the surrounding areas.
Highlights of the real estate market from TREBB and RAHB
“Greater Toronto Area (GTA) home sales increased strongly year-over year in October 2024. Over the same period, new listings were up, but by a lesser annual rate. The result was tighter market conditions compared to October 2023. The average selling price was up slightly on an annual basis.
“While we are still early in the Bank of Canada’s rate cutting cycle, it definitely does appear that an increasing number of buyers moved off the sidelines and back into the marketplace in October. The positive affordability picture brought about by lower borrowing costs and relatively flat home prices, prompted this improvement in market activity,” said Toronto Regional Real Estate Board (TRREB) President Jennifer Pearce.
GTA REALTORS® reported 6,658 home sales through TRREB’s MLS® System in October 2024 – up by 44.4% compared to 4,611 sales reported in October 2023. New listings entered into the MLS® System amounted to 15,328 – up by 4.3% year-over-year. On a seasonally adjusted basis, October sales increased month-over-month compared to September. The MLS® Home Price Index Composite benchmark was down by 3.3% year-over-year in October 2024. The average selling price was up by 1.1% compared to October 2023 to $1,135,215. On a seasonally adjusted basis, the average selling price edged up compared to September.
“Market conditions did tighten in October, but there is still a lot of inventory and therefore choice for home buyers. This choice will keep home price growth moderate over the next few months. However, as inventory is absorbed and home construction continues to lag population growth, selling price growth will accelerate, likely as we move through the spring of 2025,” said TRREB Chief Market Analyst Jason Mercer.”
Over in the Hamilton-Burlington area: “Home sales improved over last month and last year’s levels for the second consecutive month. While October sales are still lower than long-term trends for the month, this represents a significant improvement.
“Many potential purchasers were happy to sit on the sidelines until there was more certainty regarding interest rate movements. The recent rounds of cuts seem to be the incentive needed for some to enter the market. While sales are still lower than historical trends, we expect to see changes as the Bank of Canada makes further cuts to interest rates, making purchasing more attainable for hopeful buyers,” says Nicolas von Bredow, Cornerstone spokesperson for the Hamilton-Burlington market area.
The rise in sales relative to new listings supported a modest monthly decline in inventory levels, which aligns with typical seasonal behaviour. Nonetheless, the adjustment caused the months-of-supply to fall below four months, representing a shift from buyer’s market conditions to a more balanced market. While this shift is likely welcome news for many sellers, it is important to note that supply levels remain elevated compared to sales in the region, and it will take time to work through the inventory.
Despite the adjustment, prices still eased, albeit at a slower pace. In October, the unadjusted benchmark price was $820,800, a decline over last month and less than 1% lower than levels reported last year.”
Questions about buying or selling? Reach out anytime, I’d be happy to discuss the market with you!
All the latest home prices and statistics by property type and city below!

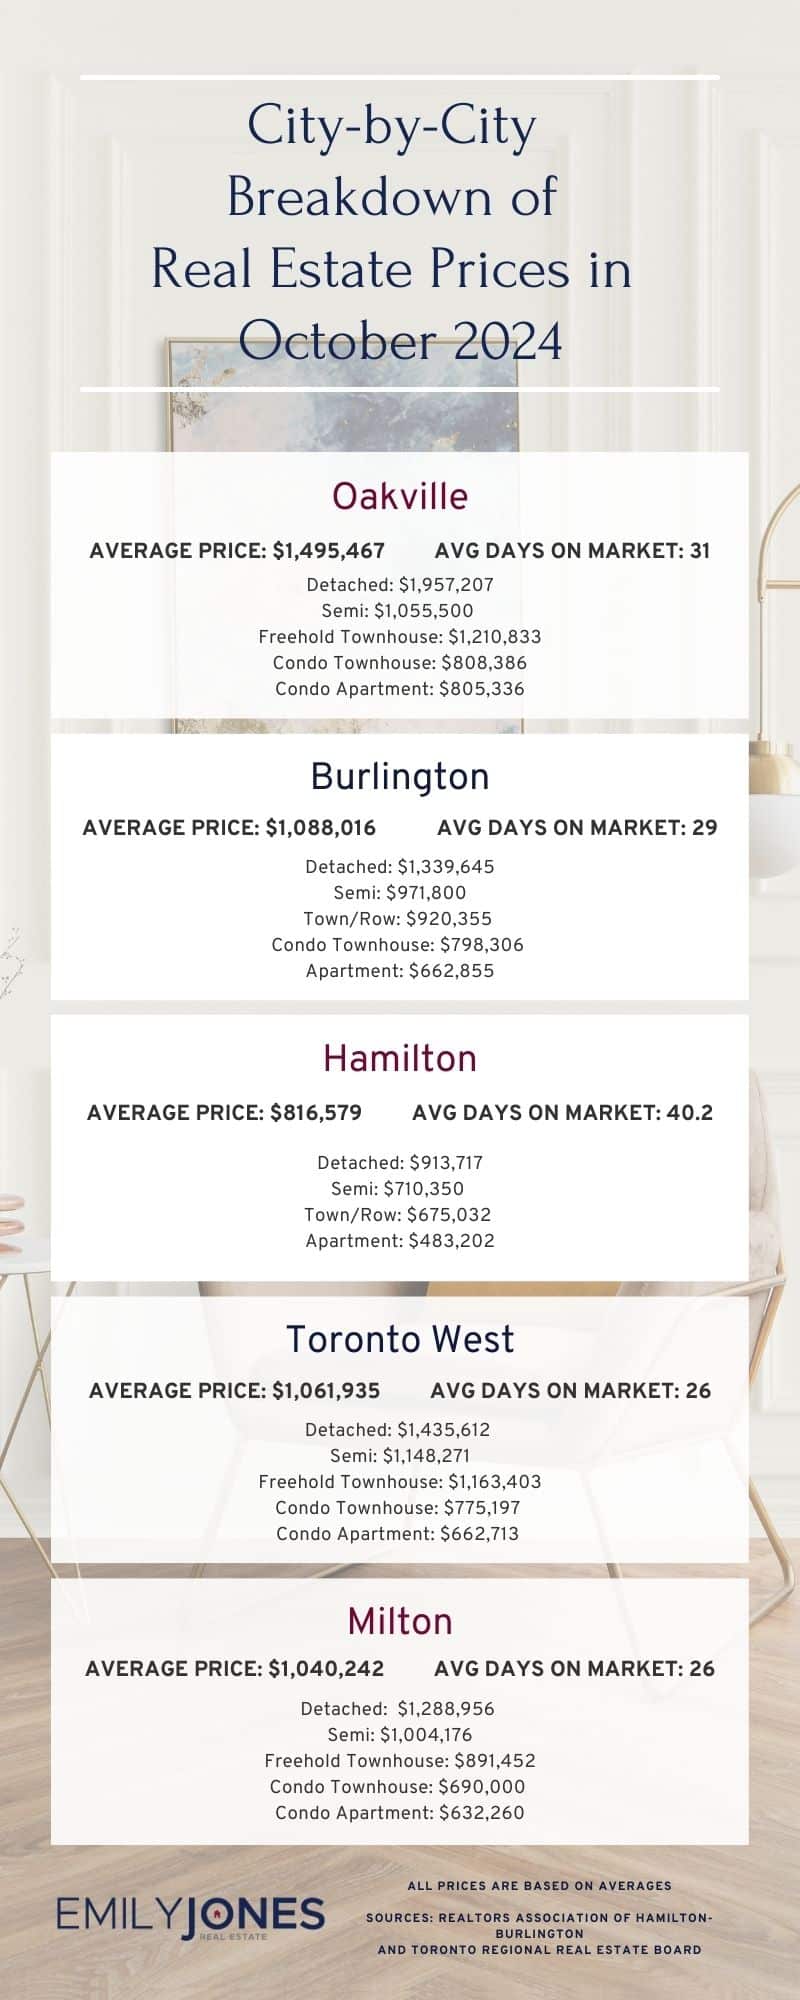
Burlington
Average Sale Price: $1,088,016 compared to $1,159,810 last month
Average Days on Market: 29 days
Detached: $1,339,645 (vs September 2024 $1,550,894)
Semi: $971,800 (vs September 2024 $977,688)
Town/Row: $920,355 (vs September 2024 $901,870)
Condo Townhouse: $798,306 (vs September 2024 $824,909)
Apartment: $662,855 (vs September 2024 $674,835)
Hamilton
Average Sale Price: $821,512 compared to $816,579 last month
Average Days on Market: 36.5 days
Detached: $913,717 (vs September 2024 $911,410)
Semi: $710,350 (vs September 2024 $678,917)
Town/Row: $675,032 (vs September 2024 $666,675)
Apartment: $483,202 (vs September 2024 $489,711)
Oakville
Average Sale Price: $1,495,467 compared to $1,585,452 last month
Average Days on Market: 31 days
Detached: $1,957,207 (vs September 2024 $2,193,729)
Semi: $1,055,500 (vs September 2024 $1,076,667)
Freehold Townhouse: $1,210,833 (vs September 2024 $1,146,384)
Condo Townhouse: $808,386 (vs September 2024 $765,207)
Condo Apartment: $805,336 (vs September 2024 $684,072)
Mississauga
Average Sale Price: $1,081,951 compared to $1,048,914 last month
Overall Average Days on Market: 28 days
Detached: $1,610,524 (vs September 2024 $1,461,044)
Semi: $1,008,686 (vs September 2024 $980,808)
Freehold Townhouse: $974,750 (vs September 2024 $1,014,942)
Condo Townhouse: $792,854 (vs September 2024 $786,042)
Condo Apartment: $588,672 (vs September 2024 $612,937)
Toronto West
Average Sale Price: $1,061,935 compared to $1,037,669 last month
Average Days on Market: 26 days
Detached: $1,435,612 (vs September 2024 $1,439,884)
Semi: $1,148,271 (vs September 2024 $1,074,363)
Freehold Townhouse: $1,163,403 (vs September 2024 $1,140,732)
Condo Townhouse: $775,197 (vs September 2024 $792,932)
Condo Apartment: $662,713 (vs September 2024 $630,529)
Milton
Average Sale Price: $1,040,242 compared to $1,021,471 last month
Average Days on Market: 26 days
Detached: $1,288,956 (vs September 2024 $1,258,935)
Semi: $1,004,176 (vs September 2024 $982,643)
Freehold Townhouse: $891,452 (vs September 2024 $904,489)
Condo Townhouse: $690,000 (vs September 2024 $714,780)
Condo Apartment: $632,260 (vs September 2024 $636,960)
Sources for Real Estate Market Update for October 2024 : Toronto Regional Real Estate Board and REALTORS® Association of Hamilton-Burlington

