
03 Nov Real Estate Market October 2022
“Despite the continued housing market transition to a higher borrowing cost environment, the average selling price in the Greater Toronto Area (GTA) found some support near $1.1 million since the late summer. GTA home sales continued to adjust to substantially higher interest rates in October 2022, both on an annual and monthly basis. However, new listings are also down year-over-year and month-over-month. The persistent lack of inventory helps explain why the downward trend in home prices experienced in the spring has flattened over the past three months.
GTA REALTORS® reported 4,961 sales through the Toronto Regional Real Estate Board’s (TRREB) MLS® System in October 2022 – a similar number to September 2022 but down by 49.% compared to October 2021. Year-over-year sales declines were similar across major market segments.
New listings were down by 11.6% year-over-year and reached an October level not seen since 2010. New listings were down on an annual basis more so for mid-density and high-density home types, which helps to explain why prices have held up better in these categories compared to detached houses.
“With new listings at or near historic lows, a moderate uptick in demand from current levels would result in a noticeable tightening in the resale housing market in short order. Obviously, there is still a lot of short-term economic uncertainty. In the medium-to-long-term, however, the demand for housing will rebound. Public policy initiatives like the recently introduced provincial More Homes Built Faster Act and strong mayor provisions will help ensure we see more homes being built to affordably meet the needs of new households,” said TRREB President Kevin Crigger.
The MLS® Home Price Index (HPI) Composite Benchmark was down by 1.3% year-over-year in October 2022. The average selling price for all home types combined, at $1,089,428, was down by 5.7% compared to October 2021. The monthly trends for both the MLS® HPI Composite and the average selling price have flattened in recent months following steeper declines in the spring and early summer.”
In the Hamilton – Burlington area, sales were similar to last month. “While sales are below the ten-year average, new listings levels are higher than last year and support more balanced conditions when measured against sales. The adjustments in sales relative to new listings have caused inventory levels to rise from record lows, but inventories remain well below record highs.
“There is no question that we have seen a shift from the unsustainable activity that occurred throughout the pandemic as some of the supply challenges have eased,” says Lou Piriano, President of RAHB. “While fewer new properties are being listed below $800,000, there are more opportunities for buyers looking to move up in the market. The danger for both buyers and sellers can be trying to time the market. With conditions sometimes turning quickly or silently, it is important to talk to a professional RAHB REALTOR® who is plugged into the local market.”
For the moment, prices continue to trend down from the peak levels reported earlier this year, with the October benchmark price reaching $836,800, 6% lower than in the same period last year. However, compared to home prices pre-pandemic, which were below $600,000, prices remain over 40% higher than 2019 and 16% higher than 2020. In the short term, varying price trends are likely to continue without action to combat inflation, higher interest rates and a lack of supply in lower priced homes. It remains imperative that all levels of government work together to tackle affordable and attainable housing supply challenges.”
For a closer look at the numbers and a city-by-city breakdown by property type, take a look below:
Questions about buying or selling? Reach out anytime, I’d be happy to discuss the market with you!
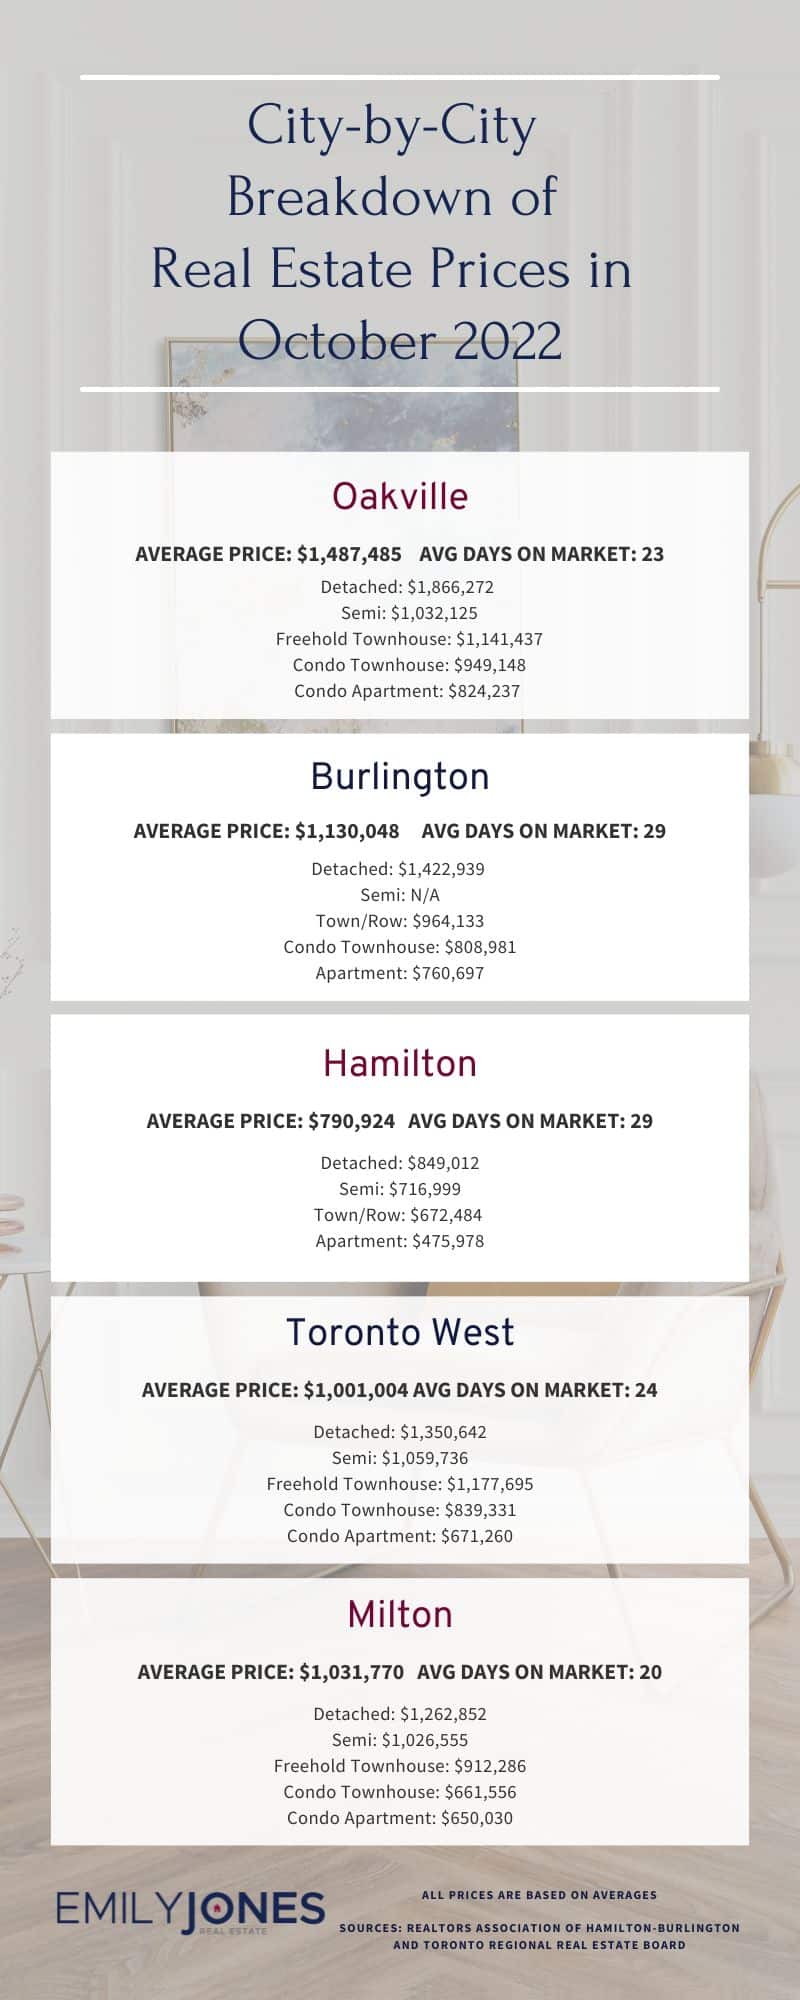
Burlington
Average Sale Price: $1,130,048 compared to $1,059,736 last month
Average Days on Market: 29 days
Detached: $1,422,939 (vs Sept 2022 $1,368,457)
Semi: N/A (vs Sept 2022 $894,346 )
Town/Row: $964,133 (vs Sept 2022 $920,674)
Condo Townhouse: $808,981 (vs Sept 2022 $875,777)
Apartment: $760,697 (vs Sept 2022 $632,656)
Hamilton
Average Sale Price: $790,924 compared to $782,611 last month
Average Days on Market: 29 days
Detached: $849,012 (vs Sept 2022 $843,260)
Semi: $716,999 (vs Sept 2022 $649,057)
Town/Row: $672,484 (vs Sept 2022 $690,501)
Apartment: $475,978 (vs Sept 2022 $494,945)
Oakville
Average Sale Price: $1,487,485 compared to $1,534,810 last month
Average Days on Market: 23 days
Detached: $1,866,272 (vs Sept 2022 $1,954,214)
Semi: $1,032,125 (vs Sept 2022 $1,269,250)
Freehold Townhouse: $1,141,437 (vs Sept 2022 $1,207,173)
Condo Townhouse: $949,148 (vs Sept 2022 $887,000)
Condo Apartment: $824,237 (vs Sept 2022 $732,306)
Mississauga
Average Sale Price: $987,356 compared to $1,032,889 last month
Overall Average Days on Market: 23 days
Detached: $1,389,165 (vs Sept 2022 $1,440,490)
Semi: $1,010,925 (vs Sept 2022 $998,134)
Freehold Townhouse: $979,192 (vs Sept 2022 $963,571)
Condo Townhouse: $793,735 (vs Sept 2022 $817,317)
Condo Apartment: $648,801 (vs Sept 2022 $638,382)
Toronto West
Average Sale Price: $1,001,004 compared to $987,438 last month
Average Days on Market: 24 days
Detached: $1,350,642 (vs Sept 2022 $1,359,662)
Semi: $1,059,736 (vs Sept 2022 $1,061,856)
Freehold Townhouse: $1,177,695 (vs Sept 2022 $1,019,477)
Condo Townhouse: $839,331 (vs Sept 2022 $750,498)
Condo Apartment: $671,260 (vs Sept 2022 $669,378)
Milton
Average Sale Price: $1,031,770 compared to $1,060,886 last month
Average Days on Market: 20 days
Detached: $1,262,852 (vs Sept 2022 $1,376,076)
Semi: $1,026,555 (vs Sept 2022 $1,059,125)
Freehold Townhouse: $912,286 (vs Sept 2022 $909,920)
Condo Townhouse: $661,556 (vs Sept 2022 $681,625)
Condo Apartment: $650,030 (vs Sept 2022 $621,611)
Sources for Real Estate Market Update for October 2022 : Toronto Regional Real Estate Board and REALTORS® Association of Hamilton-Burlington