
05 Dec Real Estate Market November 2023
Your November 2023 real estate market update is here! Covering Toronto, Oakville, Burlington, Hamilton and the surrounding areas.
Highlights of the real estate market from TREBB and RAHB
High borrowing costs and uncertain economic conditions continued to weigh on Greater Toronto Area (GTA) home sales in November 2023. Sales were down on a year-over-year basis, while listings were up from last year’s trough in supply. With more choice in the market, selling prices remained basically flat year-over-year.
“Inflation and elevated borrowing costs have taken their toll on affordability. This has been no more apparent than in the interest-rate-sensitive housing market. However, it does appear relief is on the horizon. Bond yields, which underpin fixed-rate mortgages have been trending lower and an increasing number of forecasters are anticipating Bank of Canada rate cuts in the first half of 2024. Lower rates will help alleviate affordability issues for existing homeowners and those looking to enter the market,” said Toronto Regional Real Estate Board (TRREB) President Paul Baron.
GTA REALTORS® reported 4,236 sales through TRREB’s MLS® System in November 2023 – a 6% decline compared to November 2022. Over the same period, the number of new listings was up by 16.5%. On a seasonally adjusted monthly basis, sales edged up compared to October 2023, while new listings were down by 5.5%.
The MLS® Home Price Index Composite benchmark and the average selling price, at $1,082,179, in November 2023 were basically flat in comparison to November 2022. On a seasonally adjusted monthly basis, the MLS® HPI Composite benchmark was down by 1.7%. The average selling price was down 2.2 month-over-month.
The REALTORS® Association of Hamilton-Burlington (RAHB) reported declines in November sales, making it one of the weakest Novembers since 2010. Rising sales for apartment-style and semi-detached homes were insufficient to offset pullbacks in detached and row home sales. Year-to-date sales are down by 11% over last year and are 30% below the long-term trends.
New listings trended down over the last month; however, this is typical for this time of year. There were 1,384 new listings, which elevated supply levels higher than traditionally reported in November. Despite this, inventories trended down over the last month, but with 2,728 units available, supply levels are 23% higher than last year and 32% above long-term November trends.
“Persistently high lending rates are not only impacting demand but have also supported gains in new listings over the second half of the year. Consumers are generally seeking out homes in the lower price ranges. However, much of the recent growth in new listings has been driven by higher-priced homes creating buyer market conditions in the upper end of the market,” says Nicolas von Bredow, President of RAHB.
Region-wide, months of supply has hovered above four months for the third consecutive month. Homes priced above $800,000 make up the majority of months of supply. Conditions are more balanced for lower-priced properties. Additional supply has weighed on home prices, which have eased compared to levels reported earlier this year. As of November, the unadjusted benchmark price was $805,700, nearly 3% lower than last month and last year’s levels.
Questions about buying or selling? Reach out anytime, I’d be happy to discuss the market with you!
All the latest home prices and statistics by property type and city below!
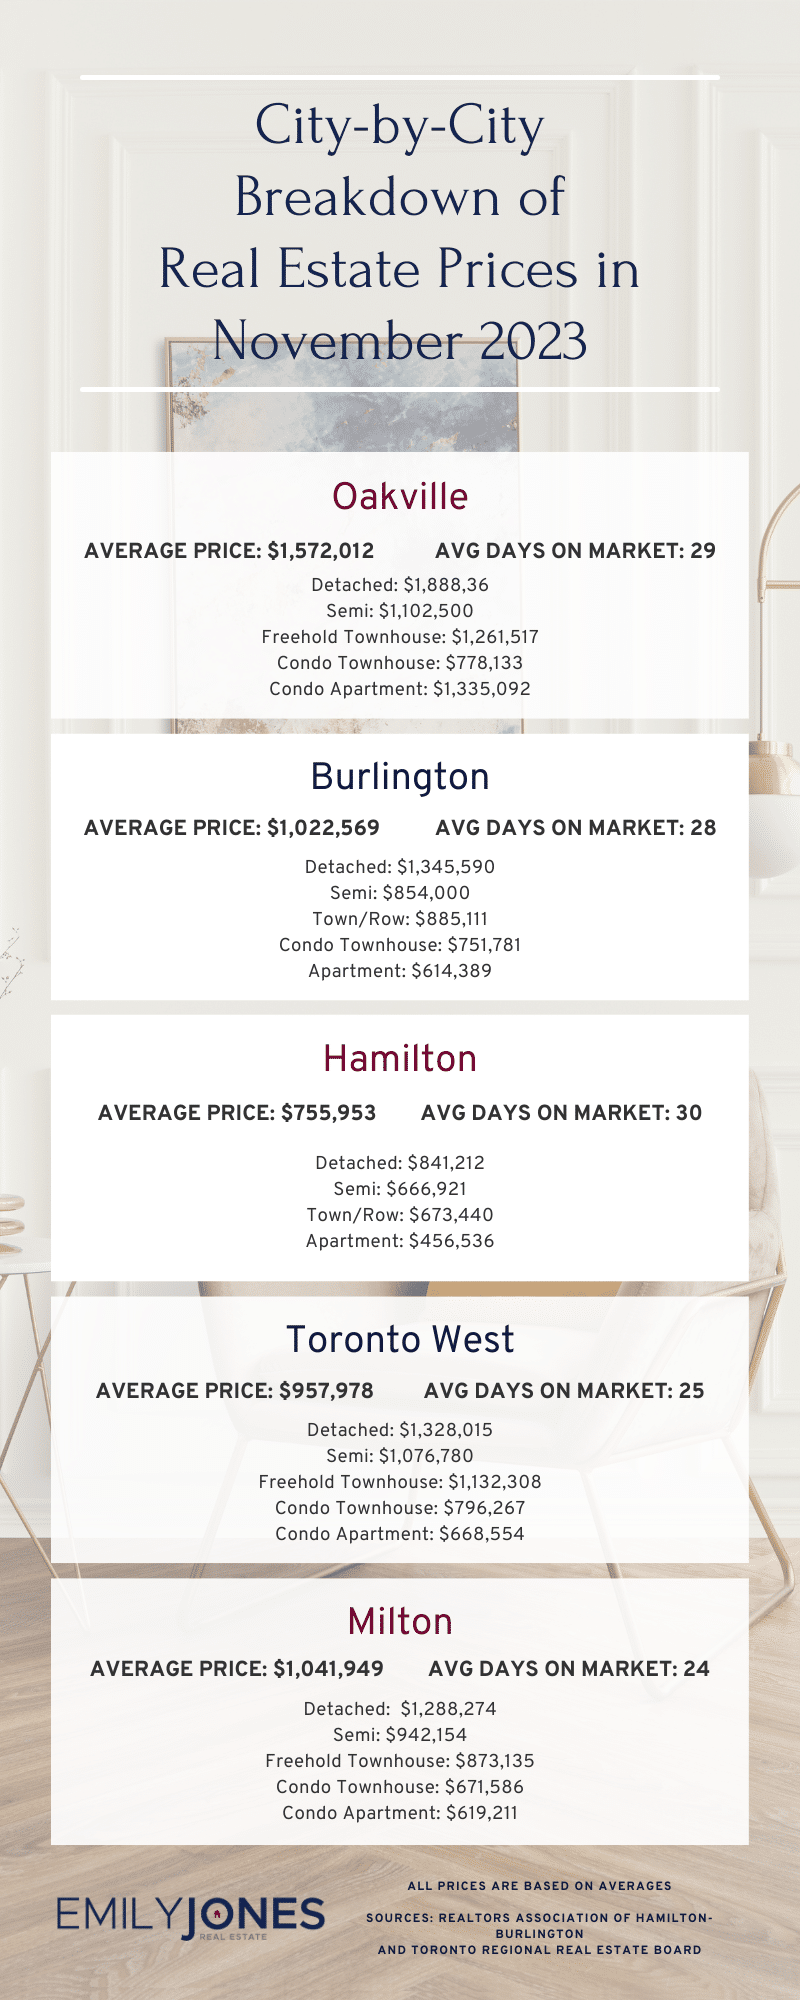
Burlington
Average Sale Price: $1,022,569 compared to $1,140,816 last month
Average Days on Market: 28 days
Detached: $1,345,590 (vs Oct 2023 $1,455,498)
Semi: $854,000 (vs Oct 2023 $963,500)
Town/Row: $885,111 (vs Oct 2023 $1,065,250)
Condo Townhouse: $751,781 (vs Oct 2023 $845,843)
Apartment: $614,389 (vs Oct 2023 $625,759)
Hamilton
Average Sale Price: $755,953 compared to $789,040 last month
Average Days on Market: 30 days
Detached: $841,212 (vs Oct 2023 $870,085)
Semi: $666,921 (vs. Oct $666,921)
Town/Row: $673,440 (vs Oct 2023 $650,963)
Apartment: $456,536 (vs Oct 2023 $495,705)
Oakville
Average Sale Price: $1,572,012 compared to $1,395,752 last month
Average Days on Market: 29 days
Detached: $1,888,364 (vs Oct 2023 $1,784,427)
Semi: $1,102,500 (vs Oct 2023 $1,078,296)
Freehold Townhouse: $1,261,517 (vs Oct 2023 $1,252,830)
Condo Townhouse: $778,133 (vs Oct 2023 $757,100)
Condo Apartment: $1,335,092 (vs Oct 2023 $811,372)
Mississauga
Average Sale Price: $993,352 compared to $1,106,263 last month
Overall Average Days on Market: 26 days
Detached: $1,398,829 (vs Oct 2023 $1,564,286)
Semi: $1,056,765 (vs Oct 2023 $980,912)
Freehold Townhouse: $966,667 (vs Oct 2023 $1,015,917)
Condo Townhouse: $764,399 (vs Oct 2023 $791,564)
Condo Apartment: $649,756 (vs Oct 2023 $626,630)
Toronto West
Average Sale Price: $957,978 compared to $1,029,487 last month
Average Days on Market: 25 days
Detached: $1,328,015 (vs Oct 2023 $1,438,834)
Semi: $1,076,780 (vs Oct 2023 $1,080,554)
Freehold Townhouse: $1,132,308 (vs Oct 2023 $1,102,094)
Condo Townhouse: $796,267 (vs Oct 2023 $843,178)
Condo Apartment: $668,554 (vs Oct 2023 $666,221)
Milton
Average Sale Price: $1,041,949 compared to $1,036,226 last month
Average Days on Market: 24 days
Detached: $1,288,274 (vs Oct 2023 $1,334,432)
Semi: $942,154 (vs Oct 2023 $1,009,042)
Freehold Townhouse: $873,135 (vs Oct 2023 $902,334)
Condo Townhouse: $671,586 (vs Oct 2023 $921,014)
Condo Apartment: $619,211 (vs Oct 2023 $652,044)
Sources for Real Estate Market Update for November 2023 : Toronto Regional Real Estate Board and REALTORS® Association of Hamilton-Burlington