
09 Dec Real Estate Market November 2022
Homeownership market activity in November continued to be influenced by the impact of higher borrowing costs on affordability. Sales were down markedly compared to the same period last year, following the trend that unfolded since the commencement of interest rate hikes in the spring. New listings were also down substantially from last year, and at a very low level historically. The fact that the supply of homes for sale has remained low, has supported average selling prices at the $1.08 to $1.09 million mark since August.
Greater Toronto Area (GTA) REALTORS® reported 4,544 sales through TRREB’s MLS® System in November 2022 – down 49% compared to November 2021, but remaining at a similar level to October especially after considering the recurring seasonal downward trend in the fall. New listings, at 8,880, were down on both a year-over-year basis and month-over-month basis.
“Increased borrowing costs represent a short-term shock to the housing market. Over the medium- to long-term, the demand for ownership housing will pick up strongly. This is because a huge share of record immigration will be pointed at the GTA and the Greater Golden Horseshoe (GGH) in the coming years, and all of these people will require a place to live, with the majority looking to buy. The long-term problem for policymakers will not be inflation and borrowing costs, but rather ensuring we have enough housing to accommodate population growth,” said TRREB President Kevin Crigger.
The MLS® Home Price Index Composite Benchmark was down by 5.5% year-over-year in November 2022. The average selling price for all home types combined was down by 7.2% year-over-year. Annual price declines continued to be greater for more expensive market segments, including detached and semi-detached houses.
“Selling prices declined from the early year peak as market conditions became more balanced and homebuyers have sought to mitigate the impact of higher borrowing costs. With that being said, the marked downward price trend experienced in the spring has come to an end. Selling prices have flatlined alongside average monthly mortgage payments since the summer,” said TRREB Chief Market Analyst Jason Mercer.
The REALTORS® Association of Hamilton-Burlington (RAHB) reported 672 sales of residential properties across the RAHB market area through the Multiple Listing Service® (MLS®) System in November 2022. The number of sales were down by 13% from October 2022 and down by 42% compared to November 2021. There were 1,248 new listings in November 2022, which was down 21% from October 2022, and compared to November 2021, there was an increase in listings of nearly 2%. The benchmark price for residential properties across the RAHB market area was $830,900, down 0.7% from October 2022, and down 9% compared to November 2021. There were 3.2 months of inventory in November 2022 compared to 3.1 months in October 2022.
“The RAHB market area has seen some much-needed improvements in supply levels allowing for more choice and negotiation power for buyers and the levels are more consistent with long-term trends for November,” said Lou Piriano, RAHB President. “It is important to note that while shifting conditions have caused prices to trend down from the peak, the pace of monthly decline has eased over the past several months. Overall, residential prices are still significantly above levels reported prior to the pandemic.”
November sales continue to ease as some purchasers put their buying decisions on hold. Year-to-date sales have fallen to the lowest level seen in over a decade. The
same pullback was not seen in new listings, and inventory levels have generally improved compared to the lows reported last year. The shift has caused the months of
supply to push above three months in November. While levels are far higher than the record lows reported over the past several years, they remained well below the
November record high of over eight months, set back in 2010. While underlying long-term fundamentals regarding supply challenges have not dissipated, the recent pullback from purchasers has led to persistent downward pressure on home prices since March this year. As of November, the benchmark price totalled $770,600, over nine per cent lower than last year’s levels, but still well above prices reported prior to the pandemic.
November sales eased relative to last year’s levels across all property types, contributing to year-over-year declines of over 30% for each property type. In addition, the detached market continues to exhibit divergent trends based on price range. Months of supply were much higher for homes priced above $800,000; meanwhile, conditions remain tight for the relatively more affordable homes in the market. If months of supply continue to be much lower in homes on the affordable end of the spectrum, we might see some price growth pressure in that area. Price pressures have also been more significant for the higher-priced detached and semi-detached homes, which may be contributing to the overall decline in price. While overall prices have trended down across all property types from earlier in the year, row and apartment benchmark prices remained higher than levels reported last November.
For a closer look at the numbers and a city-by-city breakdown by property type, take a look below:
Questions about buying or selling? Reach out anytime, I’d be happy to discuss the market with you!
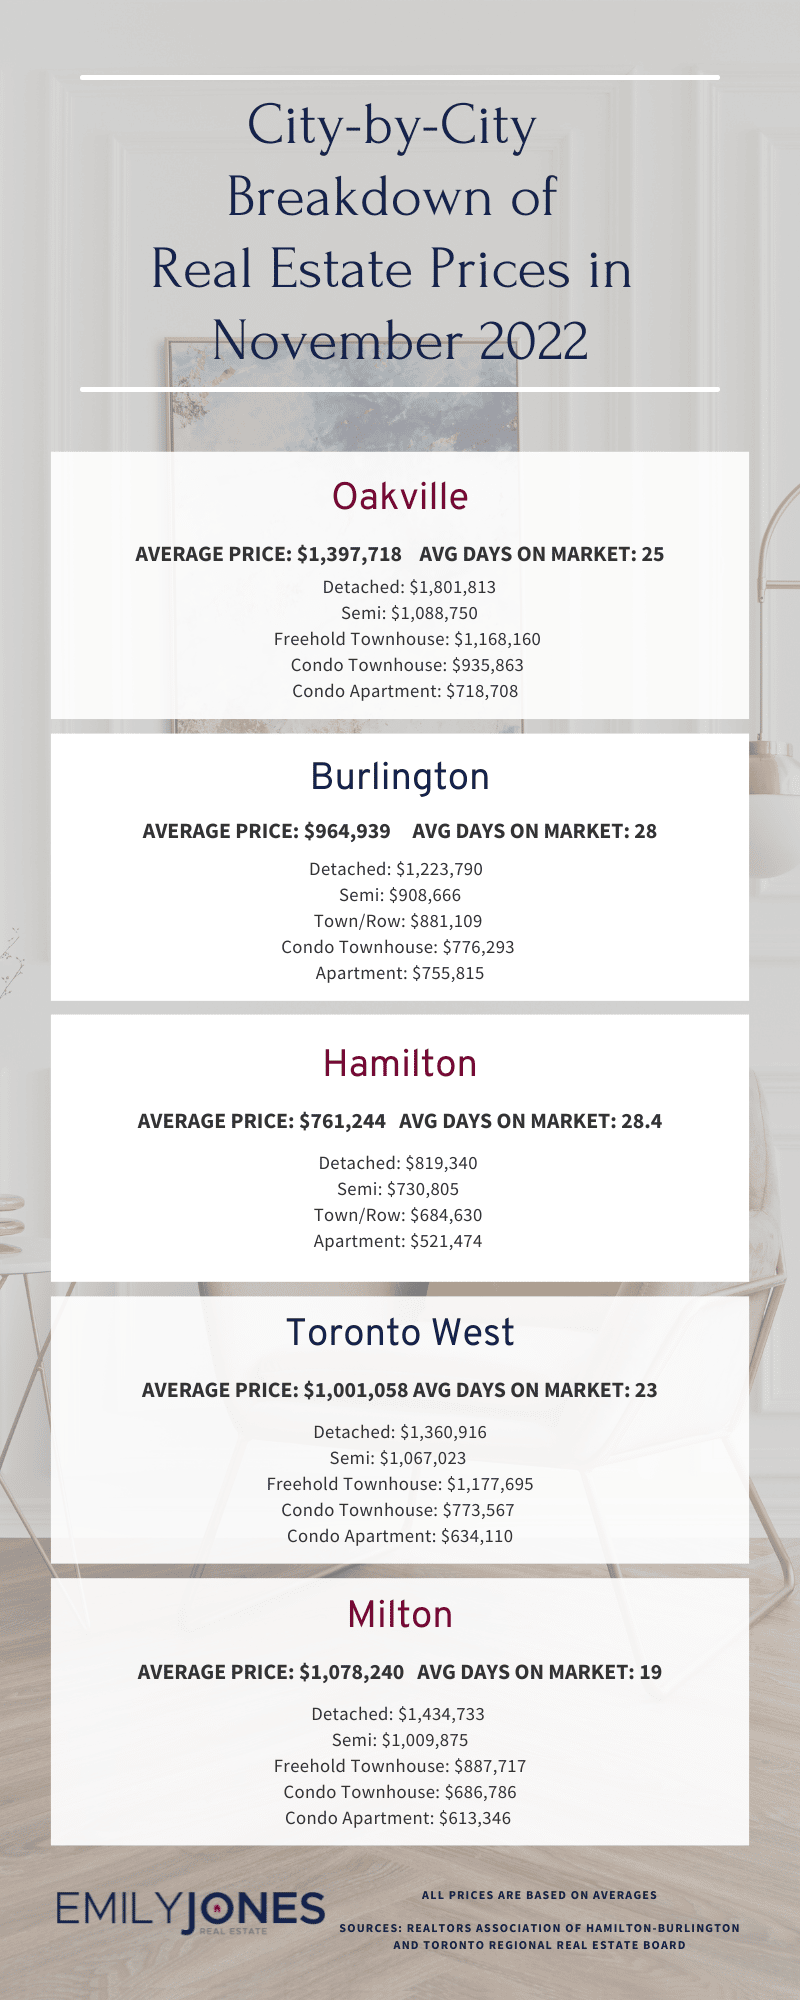
Burlington
Average Sale Price: $964,939 compared to $1,130,048 last month
Average Days on Market: 28 days
Detached: $1,223,790 (vs Oct 2022 $1,422,939)
Semi: $908,666 (vs Oct 2022 N/A)
Town/Row: $881,109 (vs Oct 2022 $964,133 )
Condo Townhouse: $776,293 (vs Oct 2022 $808,981 )
Apartment: $755,815 (vs Oct 2022 $760,697)
Hamilton
Average Sale Price: $761,244 compared to $790,924 last month
Average Days on Market: 28.4 days
Detached: $819,340 (vs Oct 2022 $849,012 )
Semi: $730,805 (vs Oct 2022 $716,999)
Town/Row: $684,630 (vs Oct 2022 $672,484)
Apartment: $521,474 (vs Oct 2022 $475,978)
Oakville
Average Sale Price: $1,397,718 compared to $1,487,485 last month
Average Days on Market: 25 days
Detached: $1,801,813 (vs Oct 2022 $1,866,272)
Semi: $1,088,750 (vs Oct 2022 $1,032,125)
Freehold Townhouse: $1,168,160 (vs Oct 2022 $1,141,437)
Condo Townhouse: $935,863 (vs Oct 2022 $949,148)
Condo Apartment: $718,708 (vs Oct 2022 $824,237)
Mississauga
Average Sale Price: $1,022,312 compared to $987,356 last month
Overall Average Days on Market: 24 days
Detached: $1,427,501 (vs Oct 2022 $1,389,165)
Semi: $984,736 (vs Oct 2022 $1,010,925)
Freehold Townhouse: $1,115,000 (vs Oct 2022 $979,192)
Condo Townhouse: $782,442 (vs Oct 2022 $793,735)
Condo Apartment: $600,605 (vs Oct 2022 $648,801)
Toronto West
Average Sale Price: $1,001,058 compared to $1,001,004 last month
Average Days on Market: 23 days
Detached: $1,360,916 (vs Oct 2022 $1,350,642)
Semi: $1,067,023 (vs Oct 2022 $1,059,736)
Freehold Townhouse: $1,045,382 (vs Oct 2022 $1,177,695)
Condo Townhouse: $773,567 (vs Oct 2022 $839,331)
Condo Apartment: $634,110 (vs Oct 2022 $671,260)
Milton
Average Sale Price: $1,078,240 compared to $1,031,770 last month
Average Days on Market: 19 days
Detached: $1,434,733 (vs Oct 2022 $1,262,852)
Semi: $1,009,875 (vs Oct 2022 $1,026,555)
Freehold Townhouse: $887,717 (vs Oct 2022 $912,286)
Condo Townhouse: $686,786 (vs Oct 2022 $661,556)
Condo Apartment: $613,346 (vs Oct 2022 $650,030)
Sources for Real Estate Market Update for November 2022 : Toronto Regional Real Estate Board and REALTORS® Association of Hamilton-Burlington