
07 Apr Real Estate Market March 2025
Your March 2025 real estate market update is here! Covering Toronto, Oakville, Burlington, Hamilton and the surrounding areas.
Highlights of the real estate market from TREBB and RAHB
“Homeownership in the Greater Toronto Area (GTA) became more affordable in March 2025 compared to the previous year. On average, both borrowing costs and home prices have declined over the past year, making monthly payments more manageable for households looking to buy a home. “Homeownership has become more affordable over the past 12 months, and we expect further rate cuts this spring. Buyers will also benefit from increased choice, giving them greater negotiating power. Once consumers feel confident in the economy and their job security, home buying activity should improve,” said Toronto Regional Real Estate Board (TRREB) President Elechia Barry-Sproule.
“Given the current trade uncertainty and the upcoming federal election, many households are likely taking a wait-and-see approach to home buying. If trade issues are solved or public policy choices help mitigate the impact of tariffs, home sales will likely increase. Home buyers need to feel their employment situation is solid before committing to
monthly mortgage payments over the long term,” said TRREB’s Chief Information Officer Jason Mercer.
GTA REALTORS® reported 5,011 home sales through TRREB’s MLS® System in March 2025 – down by 23.1% compared to March 2024. New listings in the MLS® System
amounted to 17,263 – up by 28.6% year-over-year. On a seasonally adjusted basis, March sales were down month-over-month compared to February 2025. The MLS® Home Price Index Composite benchmark was down by 3.8% year-over year in March 2025. The average selling price, at $1,093,254, was down by 2.5% compared to the March 2024. On a month-over-month seasonally adjusted basis, the MLS® HPI Composite was down and the average selling price was flat.”
Over in the Hamilton-Burlington area: “Sales in the Hamilton, Burlington, Haldimand County and Niagara North market areas fell to 701 units in March, marking the lowest level reported for that month since 2009. By the end of the third quarter, the total number of sales reached 1,854, which was 27% lower than last year’s levels. While Hamilton, Burlington, and Niagara North all experienced significant double-digit declines in sales, Haldimand County’s sales were only slightly lower than the previous year.
“Continued uncertainty about tariffs and retaliatory tariffs is impacting housing activity,” says Nicolas von Bredow, Cornerstone spokesperson for the Hamilton-Burlington market area. “These challenges have slowed sales throughout the first quarter. However, softening prices and higher inventory levels are giving buyers in the market added time and options.”
The overall pullback in sales during March was accompanied by a significant increase in new listings, maintaining the sales-to-new listings ratio relatively low at 40%. This lower ratio resulted in further inventory gains, keeping the months of supply at four months, notably higher than the levels typically reported in March. Rising supply choice combined with easing demand weighed on home prices across all property types. In March, the unadjusted total residential benchmark price was $811,000, dipping one per cent compared to February and five per cent below levels reported last March.”
Questions about buying or selling? Reach out anytime, I’d be happy to discuss the market with you!
All the latest home prices and statistics by property type and city below!
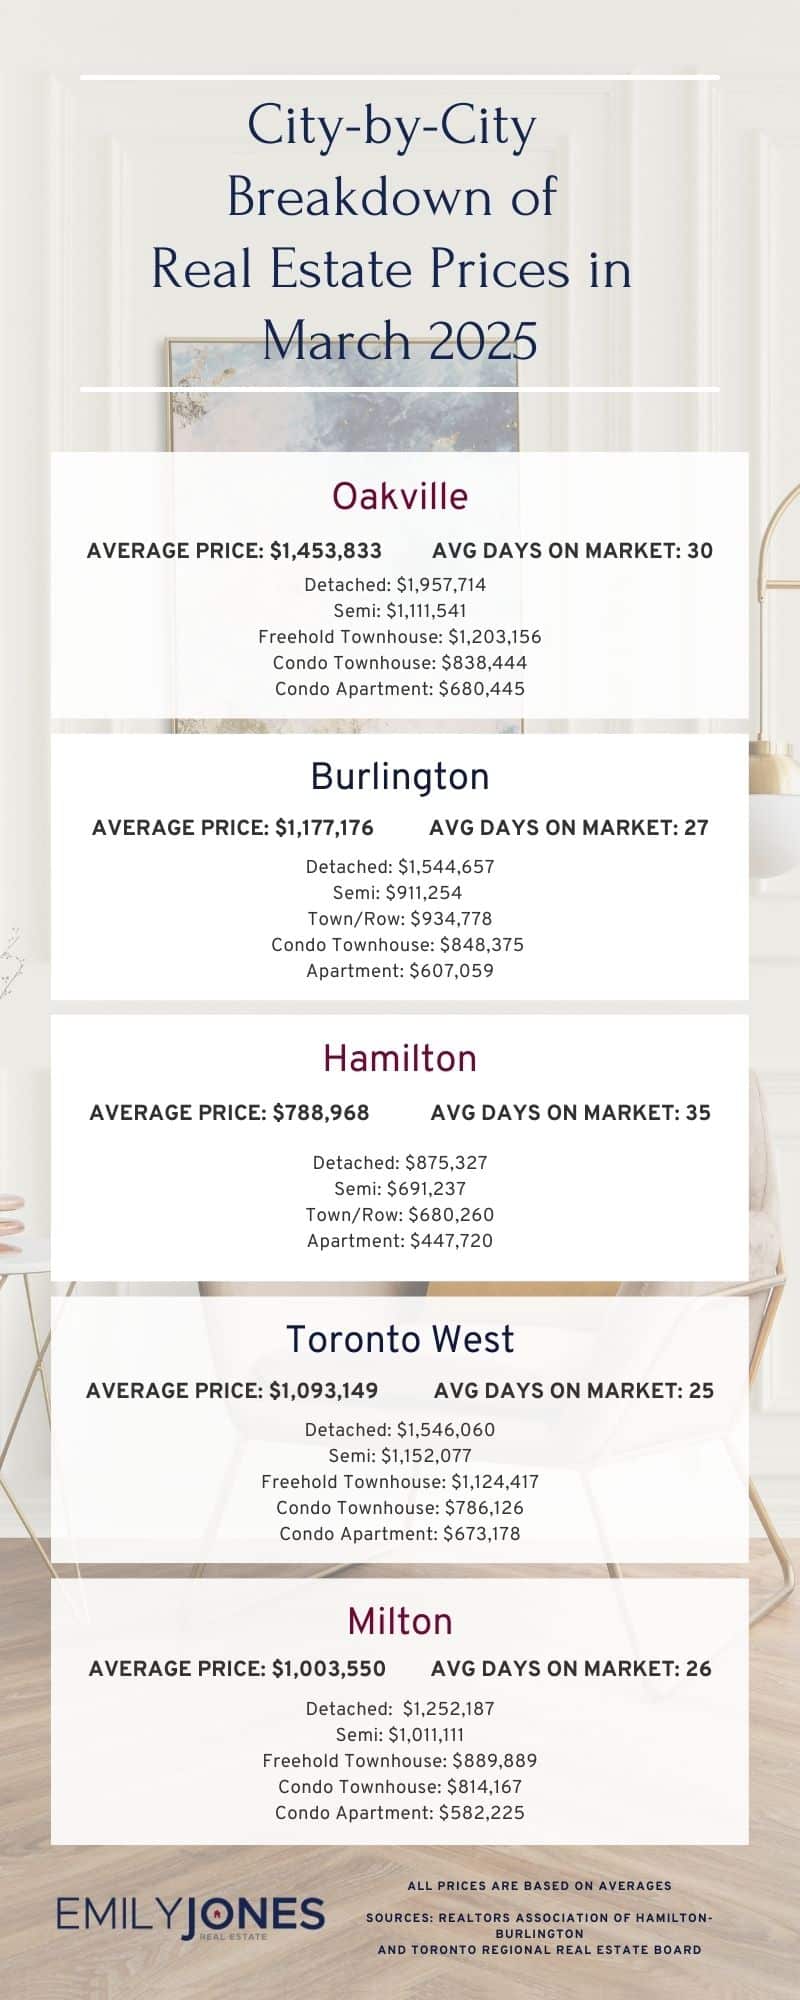
Burlington
Average Sale Price: $1,177,176 compared to $1,037,798 last month
Average Days on Market: 27 days
Detached: $1,544,657 (vs February 2025 $1,391,130)
Semi: $911,254 (vs February 2025 $1,040,000)
Town/Row: $934,778 (vs February 2025 $959,658)
Condo Townhouse: $848,375 (vs February 2025 $753,411)
Apartment: $607,059 (vs February 2025 $591,357)
Hamilton
Average Sale Price: $788,968 compared to $764,838 last month
Average Days on Market: 35 days
Detached: $875,327 (vs February 2025 $838,645)
Semi: $691,237 (vs February 2025 $693,174)
Town/Row: $680,260 (vs February 2025 $658,805)
Apartment: $447,720 (vs February 2025 $397,241)
Oakville
Average Sale Price: $1,453,833 compared to $1,504,330 last month
Average Days on Market: 30 days
Detached: $1,957,714 (vs February 2025 $2,114,747)
Semi: $1,111,541 (vs February 2025 $992,333)
Freehold Townhouse: $1,203,156 (vs February 2025 $1,115,489)
Condo Townhouse: $838,444 (vs February 2025 $773,357)
Condo Apartment: $680,445 (vs February 2025 $671,726)
Mississauga
Average Sale Price: $1,046,145 compared to $1,039,951 last month
Overall Average Days on Market: 24 days
Detached: $1,561,922 (vs February 2025 $1,606,875)
Semi: $1,003,548 (vs February 2025 $992,191)
Freehold Townhouse: $964,432 (vs February 2025 $983,833)
Condo Townhouse: $778,988 (vs February 2025 $781,259)
Condo Apartment: $583,918 (vs February 2025 $581,431)
Toronto West
Average Sale Price: $1,093,149 compared to $1,001,528 last month
Average Days on Market: 25 days
Detached: $1,546,060 (vs February 2025 $1,507,837)
Semi: $1,152,077 (vs February 2025 $1,200,240 )
Freehold Townhouse: $1,124,417 (vs February 2025 $1,083,417)
Condo Townhouse: $786,126 (vs February 2025 $755,675)
Condo Apartment: $673,178 (vs February 2025 $644,465)
Milton
Average Sale Price: $1,003,550 compared to $975,939 last month
Average Days on Market: 26 days
Detached: $1,252,187 (vs February 2025 $1,214,048)
Semi: $1,011,111 (vs February 2025 $988,222)
Freehold Townhouse: $889,889 (vs February 2025 $902,827)
Condo Townhouse: $814,167 (vs February 2025 $707,125)
Condo Apartment: $582,225 (vs February 2025 $605,278)
Sources for Real Estate Market Update for March 2025 : Toronto Regional Real Estate Board and REALTORS® Association of Hamilton-Burlington