14 Apr Real Estate Market March 2023
Your March 2023 real estate market update is here! Covering Toronto, Oakville, Burlington, Hamilton and the surrounding areas.
Highlights of the real estate market from TREBB and RAHB
GTA housing market conditions tightened in March 2023. Sales accounted for an increased share of listings in comparison to March 2022, suggesting that competition between buyers is on the rise. The average sale price was above the average list price for the first time since May 2022.
“As we moved through the first quarter, Toronto Regional Real Estate Board (TRREB) Members were increasingly reporting that competition between buyers was heating up in many GTA neighbourhoods. The most recent statistics bear this out,” said TRREB President Paul Baron. “Recent consumer polling also suggests that demand for ownership housing will continue to recover this year. Look for first-time buyers to lead this recovery, as high average rents move more closely in line with the cost of ownership.”
GTA REALTORS® reported 6,896 sales through TRREB’s MLS® System in March 2023 – down 36.5% compared to March 2022. On a month-over-month basis, actual and seasonally adjusted sales were up. New listings were also down on a year-over-year basis, but by a much greater annual rate. This points to tighter market conditions compared to last year.
The MLS® Home Price Index composite benchmark was down by 16.2% on a year-over-year basis, but up month-over-month on both an actual and seasonally adjusted basis. Similarly, the average selling price was down by 14.6% year-over-year to $1,108,606. The average selling price was up month over-month on an actual and seasonally adjusted basis.
Over in Hamilton, The REALTORS® Association of Hamilton-Burlington market area reported 1,031 sales in March. While this is a 33% decline over last year’s levels, activity is just slightly slower than what was reported in the area before the pandemic. Higher lending rates continue to weigh on sales activity. New listings remain lower than we see in a typical pre-pandemic March. Sales and new listing activity have increased over the past several months. However, this did little to impact supply as the months of inventory levels fell below two months. Buying conditions are not as tight as they were last year. The shift in the market has resulted in more price stability and is much more comparable to the pre-pandemic market. “We are seeing our housing market shift back to activity more consistent with pre-pandemic levels and more stable pricing,” said Lou Piriano, RAHB President.
Sales in Hamilton-Burlington were down approx 30% and prices down approx 20% year over year, however, this is the third consecutive month we have seen the benchmark price increase.
Questions about buying or selling? Reach out anytime, I’d be happy to discuss the market with you!
All the latest home prices and statistics by property type and city below!

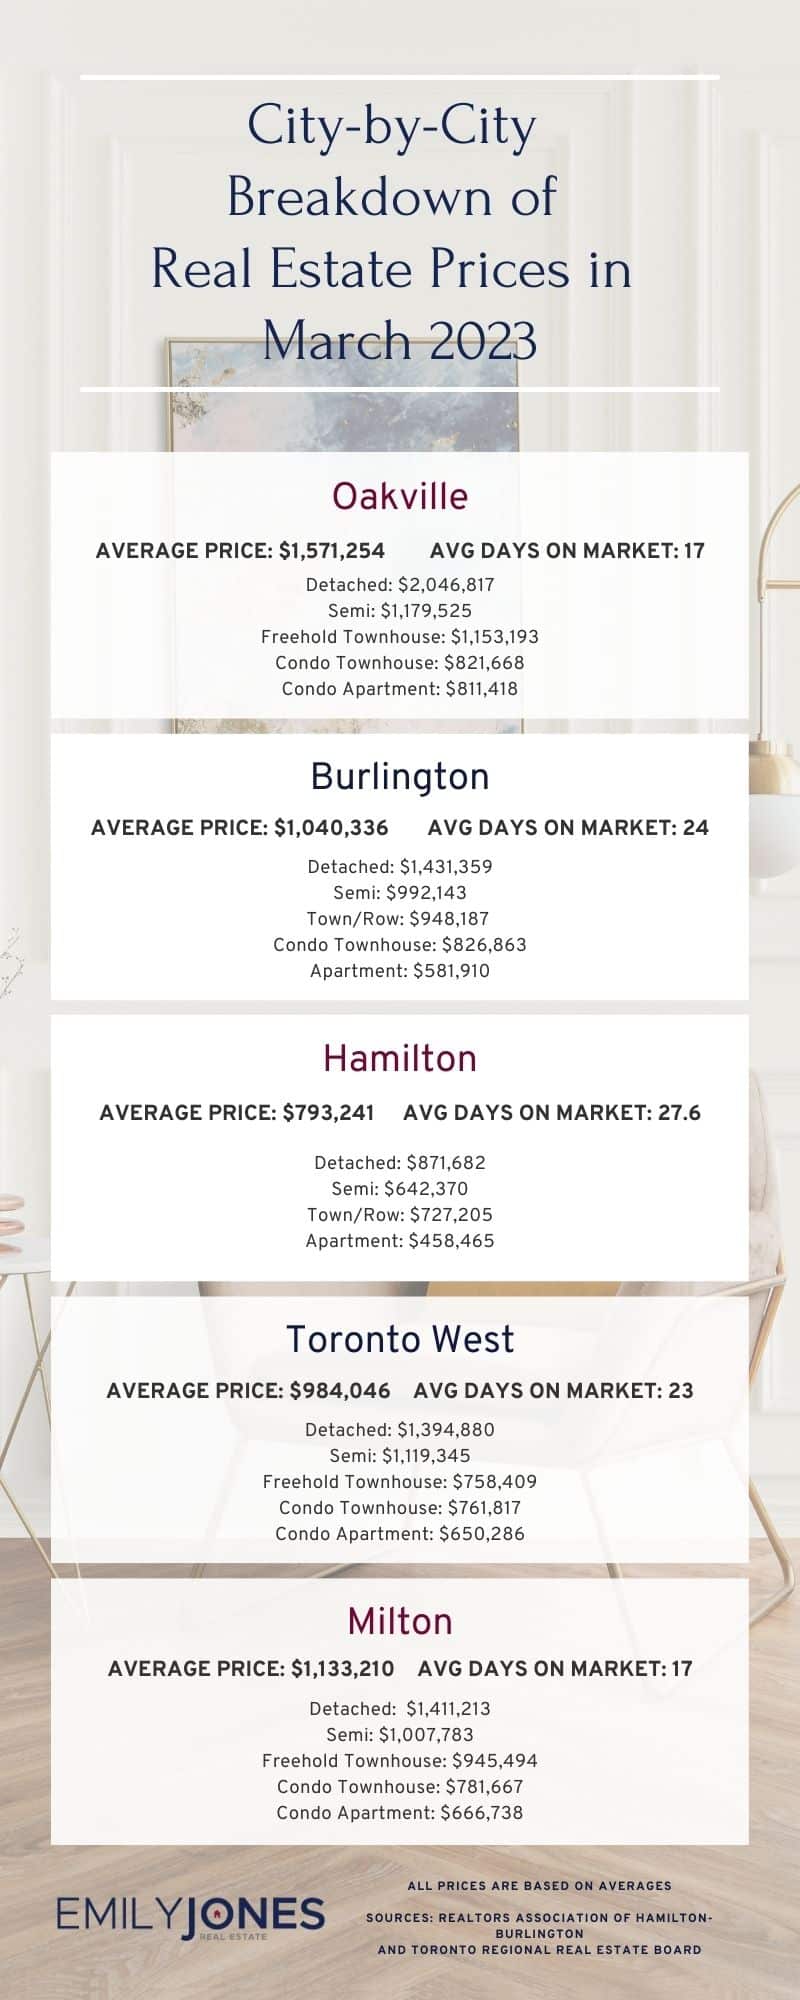
Burlington
Average Sale Price: $1,040,336 compared to $1,047,829 last month
Average Days on Market: 24 days
Detached: $1,431,359 (vs Feb 2023 $1,382,673)
Semi: $992,143 (vs Feb 2023 $973,929)
Town/Row: $948,187 (vs Feb 2023 $898,667)
Condo Townhouse: $826,863 (vs Feb 2023 $735,688)
Apartment: $581,910 (vs Feb 2023 $724,850)
Hamilton
Average Sale Price: $793,241 compared to $800,584 last month
Average Days on Market: 27.6 days
Detached: $871,682 (vs Feb 2023 $875,388)
Semi: $642,370 (vs Feb 2023 $761,011)
Town/Row: $727,205 (vs Feb 2023 $710,972)
Apartment: $458,465 (vs Feb 2023 $455,698)
Oakville
Average Sale Price: $1,571,254 compared to $1,564,949 last month
Average Days on Market: 17 days
Detached: $2,046,817 (vs Feb 2023 $1,921,486)
Semi: $1,179,525 (vs Feb 2023 $1,203,188)
Freehold Townhouse: $1,153,193 (vs Feb 2023 $1,219,685)
Condo Townhouse: $821,668 (vs Feb 2023 $807,667)
Condo Apartment: $811,418 (vs Feb 2023 $1,158,950)
Mississauga
Average Sale Price: $1,036,553$1,009,803 compared to $1,009,803 last month
Overall Average Days on Market: 17 days
Detached: $1,553,304 (vs Feb 2023 $1,543,866)
Semi: $1,057,053 (vs Feb 2023 $1,033,327)
Freehold Townhouse: $1,074,467 (vs Feb 2023 $1,004,456)
Condo Townhouse: $828,182 (vs Feb 2023 $803,277)
Condo Apartment: $614,758 (vs Feb 2023 $612,221)
Toronto West
Average Sale Price: $984,046 compared to $990,281 last month
Average Days on Market: 23 days
Detached: $1,394,880 (vs Feb 2023 $1,462,662)
Semi: $1,119,345 (vs Feb 2023 $1,079,656)
Freehold Townhouse: $1,228,167 (vs Feb 2023 $1,191,538)
Condo Townhouse: $758,409 (vs Feb 2023 $761,817)
Condo Apartment: $650,286 (vs Feb 2023 $645,913)
Milton
Average Sale Price: $1,133,210 compared to $1,055,272 last month
Average Days on Market: 17 days
Detached: $1,411,213 (vs Feb 2023 $1,318,244)
Semi: $1,007,783 (vs Feb 2023 $1,013,714)
Freehold Townhouse: $945,494 (vs Feb 2023 $745,714)
Condo Townhouse: $781,667 (vs Feb 2023 $920,802)
Condo Apartment: $666,738 (vs Feb 2023 $624,656)
Sources for Real Estate Market Update for March 2023 : Toronto Regional Real Estate Board and REALTORS® Association of Hamilton-Burlington

