
10 Jul Real Estate Market June 2023
Your June 2023 real estate market update is here! Covering Toronto, Oakville, Burlington, Hamilton and the surrounding areas.
Highlights of the real estate market from TREBB and RAHB
Home sales and the average selling price in the Greater Toronto Area (GTA) in June 2023 remained above last year’s levels. Seasonally adjusted sales dipped on a month-over-month basis. The seasonally adjusted average selling price and the MLS® Home Price Index (HPI) Composite benchmark were up compared to the previous month.
“The demand for ownership housing is stronger than last year, despite higher borrowing costs. With this said, home sales were hampered last month by uncertainty surrounding the Bank of Canada’s outlook on inflation and interest rates. Furthermore, a persistent lack of inventory likely sidelined some willing buyers because they couldn’t find a
home meeting their needs. Simply put, you can’t buy what is not available,” said Toronto Regional Real Estate Board (TRREB) President Paul Baron.
GTA REALTORS® reported 7,481 sales through TRREB’s MLS® System in June 2023 – up 16.5% compared to June 2022. The number of listings was down by 3% over the same period. The year-over-year increase in sales coupled with the decrease in new listings mean market conditions were tighter this past June relative to the same period last year. The average selling price was up by 3.% to $1,182,120. The MLS® HPI Composite benchmark was still down by 1.9% on a year-over-year basis – the lowest annual rate of decline in 2023. On a month-over-month basis the seasonally adjusted average price and MLS® HPI Composite benchmark were up.
Over in the Hamilton area, the REALTORS® Association of Hamilton-Burlington (RAHB) reported 1,115 sales in June. This represents a decrease of 182 units sold over the previous month. Despite the month-over-month decline, sales are up 19% over last year. The monthly pullback in sales was not met with the same level of pullback in new listings, which supported some modest inventory gains over the previous month. Still, inventory levels remain more than 20% lower than long-term trends for June. The increase in new listings caused market conditions to ease slightly compared to the previous three months.
“Low inventory has been a challenge throughout the past several months. Inventory levels may continue to slowly increase as buyers pause to evaluate the impacts of recent interest rate adjustments,” says Nicolas von Bredow, RAHB President. Following five consecutive months of price gains, the unadjusted benchmark price across the RAHB market area decreased 0.45% over last month to $873,100. This is a relatively insignificant decrease and remains much higher than pre-pandemic pricing.
Questions about buying or selling? Reach out anytime, I’d be happy to discuss the market with you!
All the latest home prices and statistics by property type and city below!
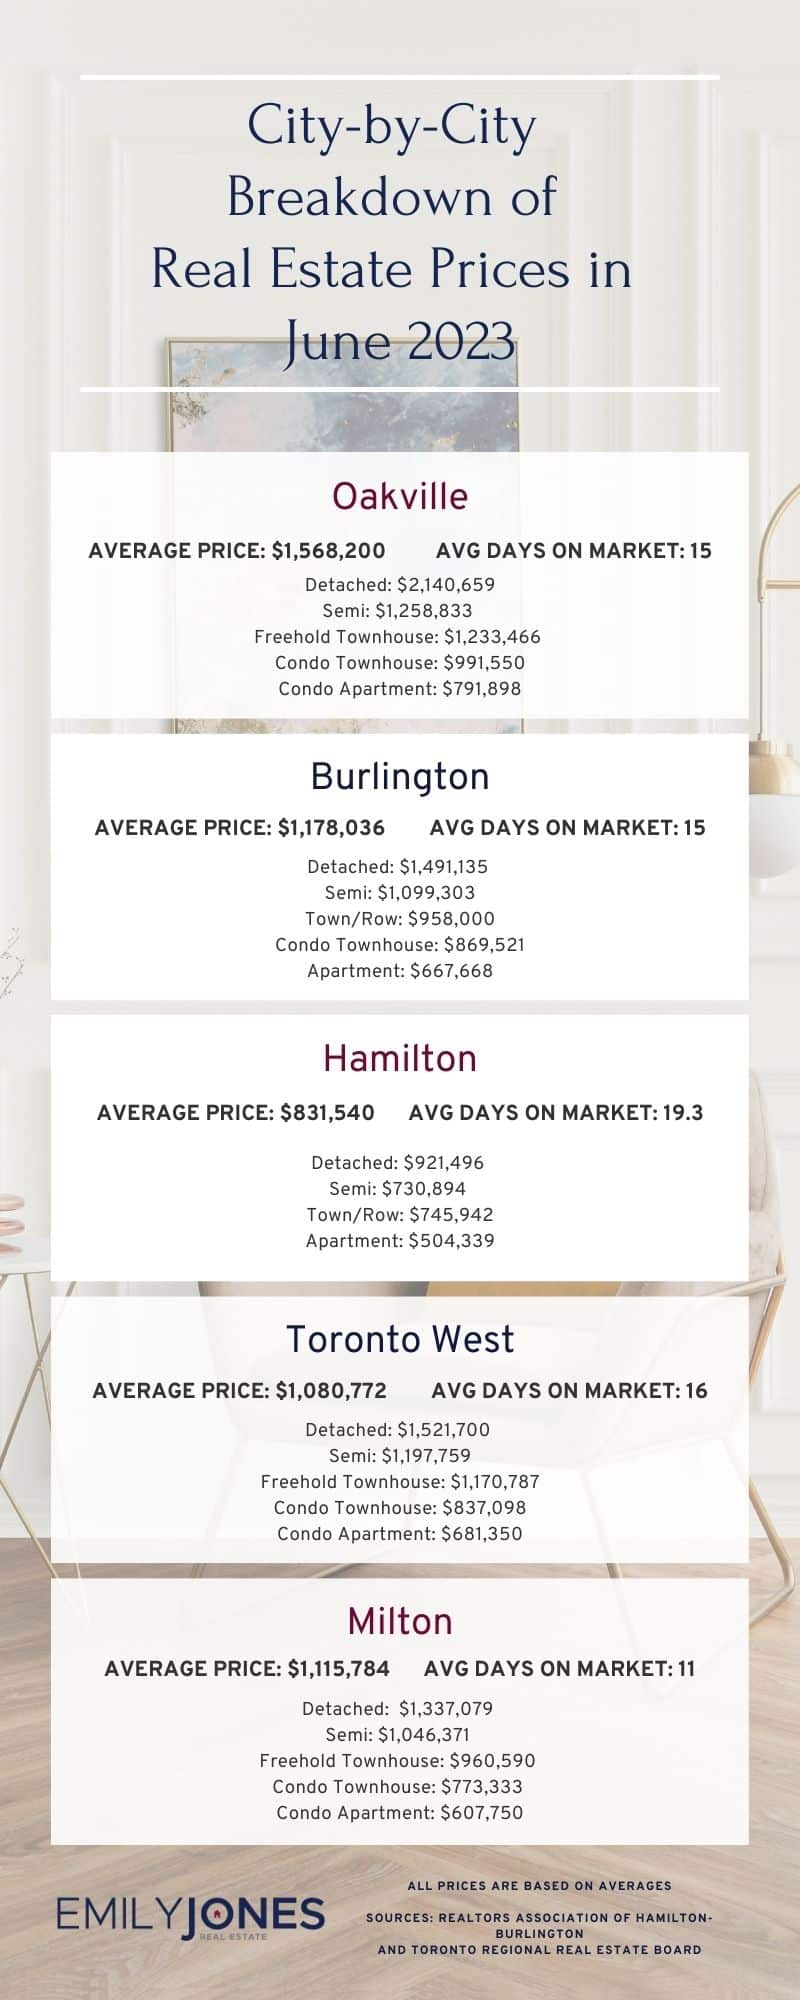
Burlington
Average Sale Price: $1,178,036 compared to $1,115,294 last month
Average Days on Market: 15 days
Detached: $1,491,135 (vs May 2023 $1,467,247)
Semi: $1,099,303 (vs May 2023 $1,001,214)
Town/Row: $958,000 (vs May 2023 $1,025,629)
Condo Townhouse: $869,521 (vs May 2023 $853,585)
Apartment: $667,668 (vs May 2023 $712,498)
Hamilton
Average Sale Price: $831,540 compared to $814,082 last month
Average Days on Market: 19.3 days
Detached: $921,496 (vs May 2023 $891,751)
Semi: $730,894 (vs May 2023 $750,242)
Town/Row: $745,942 (vs May 2023 $744,679)
Apartment: $504,339 (vs May 2023 $529,759)
Oakville
Average Sale Price: $1,568,200 compared to $1,554,259 last month
Average Days on Market: 15 days
Detached: $2,140,659 (vs May 2023 $2,079,084)
Semi: $1,258,833 (vs May 2023 $1,279,808)
Freehold Townhouse: $1,233,466 (vs May 2023$1,258,152)
Condo Townhouse: $991,550 (vs May 2023 $943,119)
Condo Apartment: $791,898 (vs May 2023 $798,507)
Mississauga
Average Sale Price: $1,112,531 compared to $1,140,328 last month
Overall Average Days on Market: 13 days
Detached: $1,602,425 (vs May 2023 $1,620,829)
Semi: $1,105,754 (vs May 2023 $1,132,822)
Freehold Townhouse: $1,019,152 (vs May 2023 $1,172,076)
Condo Townhouse: $855,074 (vs May 2023 $868,034)
Condo Apartment: $636,012 (vs May 2023 $635,856)
Toronto West
Average Sale Price: $1,080,772 compared to $1,084,986 last month
Average Days on Market: 16 days
Detached: $1,521,700 (vs May 2023 $1,526,986)
Semi: $1,197,759 (vs May 2023 $1,256,134)
Freehold Townhouse: $1,170,787 (vs May 2023 $1,188,520)
Condo Townhouse: $837,098 (vs May 2023 $791,775)
Condo Apartment: $681,350 (vs May 2023 $702,829)
Milton
Average Sale Price: $1,115,784 compared to $1,117,530 last month
Average Days on Market: 11 days
Detached: $1,337,079 (vs May 2023 $1,373,750)
Semi: $1,046,371 (vs May 2023 $1,135,746)
Freehold Townhouse: $960,590 (vs May 2023 $999,469)
Condo Townhouse: $773,333 (vs May 2023 $740,633)
Condo Apartment: $607,750 (vs May 2023 $657,493)
Sources for Real Estate Market Update for June 2023 : Toronto Regional Real Estate Board and REALTORS® Association of Hamilton-Burlington