
08 Aug Real Estate Market July 2024
Your July 2024 real estate market update is here! Covering Toronto, Oakville, Burlington, Hamilton and the surrounding areas.
Highlights of the real estate market from TREBB and RAHB
Greater Toronto Area (GTA) home sales in July 2024 were up compared to July 2023. While sales were up from last year, buyers continued to benefit from more choice in the GTA marketplace, with annual growth in new listings outstripping that of sales. The better-supplied market meant that buyers also benefitted from a slight relief in selling prices on average.
“It was encouraging to see an uptick in July sales relative to last year. We may be starting to see a positive impact from the two Bank of Canada rate cuts announced in June and July. Additionally, the cost of borrowing is anticipated to decline further in the coming months. Expect sales to accelerate as buyers benefit from lower monthly mortgage payments,” said TRREB President Jennifer Pearce.
GTA REALTORS® reported 5,391 home sales through TRREB’s MLS® System in July 2024 – a 3.3% increase compared to 5,220 sales reported in July 2023. New listings entered into the MLS® System amounted to 16,296 – up by 18.5% year-over-year. On a seasonally adjusted basis, July sales and new listings edged lower compared to June.
The MLS® Home Price Index Composite benchmark was down by approximately 5% on a year-over-year basis in July 2024. The average selling price of $1,106,617 was down by 0.9% over the July 2023 result of $1,116,950. On a seasonally adjusted monthly basis, both the MLS® HPI Composite and the average selling price were up slightly compared to June 2024.
“As more buyers take advantage of more affordable mortgage payments in the months ahead, they will benefit from the substantial build-up in inventory. This will initially keep home prices relatively flat. However, as inventory is absorbed, market conditions will tighten in the absence of a large-scale increase in home completions, ultimately leading to a resumption of price growth,” said TRREB Chief Market Analyst Jason Mercer.
Over in the Hamilton-Burlington area, a total of 804 homes were sold in July via the Multiple Listing Service® (MLS®) System of the Cornerstone Association of REALTORS® (Cornerstone), contributing to a year-to-date decline of 6%. While year-to-date sales declined across the entire Hamilton-Burlington market area, Niagara North July levels were comparable to the same time last year.
“This marks the third consecutive year that sales have remained below long-term trends. At the same time, we are experiencing a gain in new listings. While rates are slowly coming down, for some existing owners the prospect of higher renewal rates is enough to cause them to list their properties, driving up supply levels,” says Nicolas von Bredow, Cornerstone spokesperson for the Hamilton-Burlington market area.
New listings in July rose relative to sales activity, causing the sales-to-new-listings ratio to ease to 42%. Inventory levels are similar to last month and higher than last year. Months-of-supply pushed above four months. The months-of-supply has not risen above four months in July since 2010.
More supply choice has continued to place downward pressure on home prices this month. The unadjusted benchmark price was $843,500, nearly 1% lower than in June and 3% lower than last July. While prices are below the 2022 peak, levels are still higher than levels reported prior to the pandemic, and year-to-date average benchmark prices are only slightly lower than last year.
Questions about buying or selling? Reach out anytime, I’d be happy to discuss the market with you!
All the latest home prices and statistics by property type and city below!
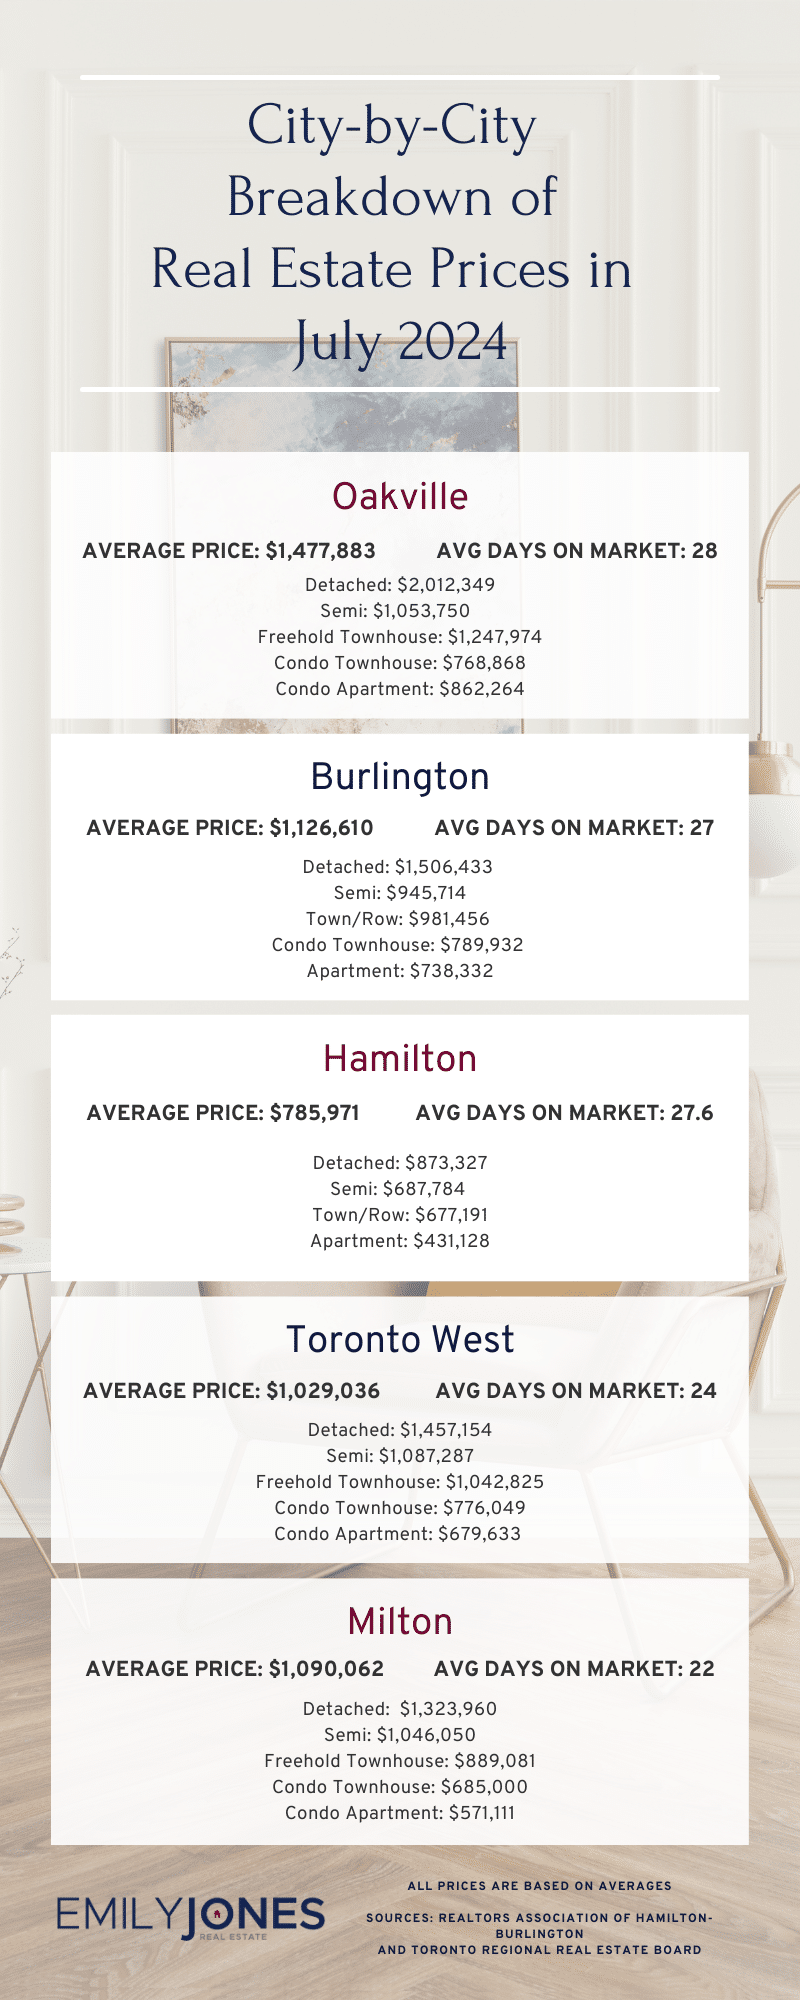
Burlington
Average Sale Price: $1,126,610 compared to $1,164,925 last month
Average Days on Market: 27 days
Detached: $1,506,433 (vs June 2024 $1,557,749)
Semi: $945,714 (vs June 2024 $929,500)
Town/Row: $981,456 (vs June 2024 $988,304)
Condo Townhouse: $789,932 (vs June 2024 $825,113)
Apartment: $738,332 (vs June 2024 $665,286)
Hamilton
Average Sale Price: $785,971 compared to $831,190 last month
Average Days on Market: 27.6 days
Detached: $873,327 (vs June 2024 $922,685)
Semi: $687,784 (vs June 2024 $738,257)
Town/Row: $677,191 (vs June 2024 $703,911)
Apartment: $431,128 (vs June 2024 $465,093)
Oakville
Average Sale Price: $1,477,883 compared to $1,482,150 last month
Average Days on Market: 28 days
Detached: $2,012,349 (vs June 2024 $1,891,709)
Semi: $1,053,750 (vs June 2024 $1,157,208)
Freehold Townhouse: $1,247,974 (vs June 2024 $1,183,664)
Condo Townhouse: $768,868 (vs June 2024 $873,461)
Condo Apartment: $862,264 (vs June 2024 $781,438)
Mississauga
Average Sale Price: $1,042,868 compared to $1,103,727 last month
Overall Average Days on Market: 24 days
Detached: $1,589,373 (vs June 2024 $1,551,752)
Semi: $986,872 (vs June 2024 $1,039,353)
Freehold Townhouse: $1,017,667 (vs June 2024 $1,039,745)
Condo Townhouse: $799,271 (vs June 2024 $803,584)
Condo Apartment: $631,810 (vs June 2024 $626,081)
Toronto West
Average Sale Price: $1,029,036 compared to $1,125,463 last month
Average Days on Market: 24 days
Detached: $1,457,154 (vs June 2024 $1,540,882)
Semi: $1,087,287 (vs June 2024 $1,115,354)
Freehold Townhouse: $1,042,825 (vs June 2024 $1,212,594)
Condo Townhouse: $776,049 (vs June 2024 $817,472)
Condo Apartment: $679,633 (vs June 2024 $657,963)
Milton
Average Sale Price: $1,090,062 compared to $1,095,665 last month
Average Days on Market: 22 days
Detached: $1,323,960 (vs June 2024 $1,382,451)
Semi: $1,046,050 (vs June 2024 $1,032,048)
Freehold Townhouse: $889,081 (vs June 2024 $897,486)
Condo Townhouse: $685,000 (vs June 2024 $735,800)
Condo Apartment: $571,111 (vs June 2024 $615,416)
Sources for Real Estate Market Update for July 2024 : Toronto Regional Real Estate Board and REALTORS® Association of Hamilton-Burlington