
21 Aug Real Estate Market July 2023
Your July 2023 real estate market update is here! Covering Toronto, Oakville, Burlington, Hamilton and the surrounding areas.
Highlights of the real estate market from TREBB and RAHB
“Greater Toronto Area (GTA) home sales, new listings and home prices were up in July 2023 in comparison to July 2022. On a seasonally adjusted basis, the market experienced more balance in July compared to June, with sales trending lower while new listings were up.
“Home sales continued to be above last year’s levels in July, which suggests that many households have adjusted to higher borrowing costs. With that being said, it does appear that the sales momentum that we experienced earlier in the spring has stalled somewhat since the Bank of Canada restarted its rate tightening cycle in June. Compounding the impact of higher rates has been the persistent lack of listings for people to purchase compared to previous years,” said Toronto Regional Real Estate Board (TRREB) President Paul Baron.
GTA REALTORS® reported 5,250 sales through TRREB’s MLS® System in July 2023, representing a 7.8% increase compared to July 2022. Over the same period, new listings were also up, but by a greater annual rate of 11.5%. The MLS® Home Price Index Composite benchmark was up by 1.3% year-over-year. The average selling price was also up by 4.2% to $1,118,374 over the same timeframe. On a seasonally adjusted monthly basis, the number of sales trended lower for the second straight month, whereas new listings trended upward. The seasonally adjusted average selling price edged lower while the MLS® HPI Composite benchmark edged higher.”
Over in Hamilton/Burlington, the REALTORS® Association of Hamilton-Burlington (RAHB) reported 797 sales across the region in July 2023, a decline of 292 sales over the previous month but a gain over levels reported in July 2022. The sales to new listings ratio fell to 44%, with 1,840 new listings reported. The number of new listings increased relative to sales, causing inventories to trend up over the last month and levels reported earlier this year.
“Another rate hike likely weighed on sales activity this month. However, it also supported further inventory gains and more balanced conditions compared to earlier this year. Despite the monthly gains in inventory, supply remains below last year’s levels and long-term trends for July,” says Nicolas von Bredow, President of RAHB.
Months of supply rose to 2.9 months over the 1.8 months reported in June. The shift away from tighter conditions has paused price growth. The unadjusted benchmark price reached $873,600 in July, relatively unchanged over last month. Overall, prices remain much higher than pre-pandemic levels.
Questions about buying or selling? Reach out anytime, I’d be happy to discuss the market with you!
All the latest home prices and statistics by property type and city below!
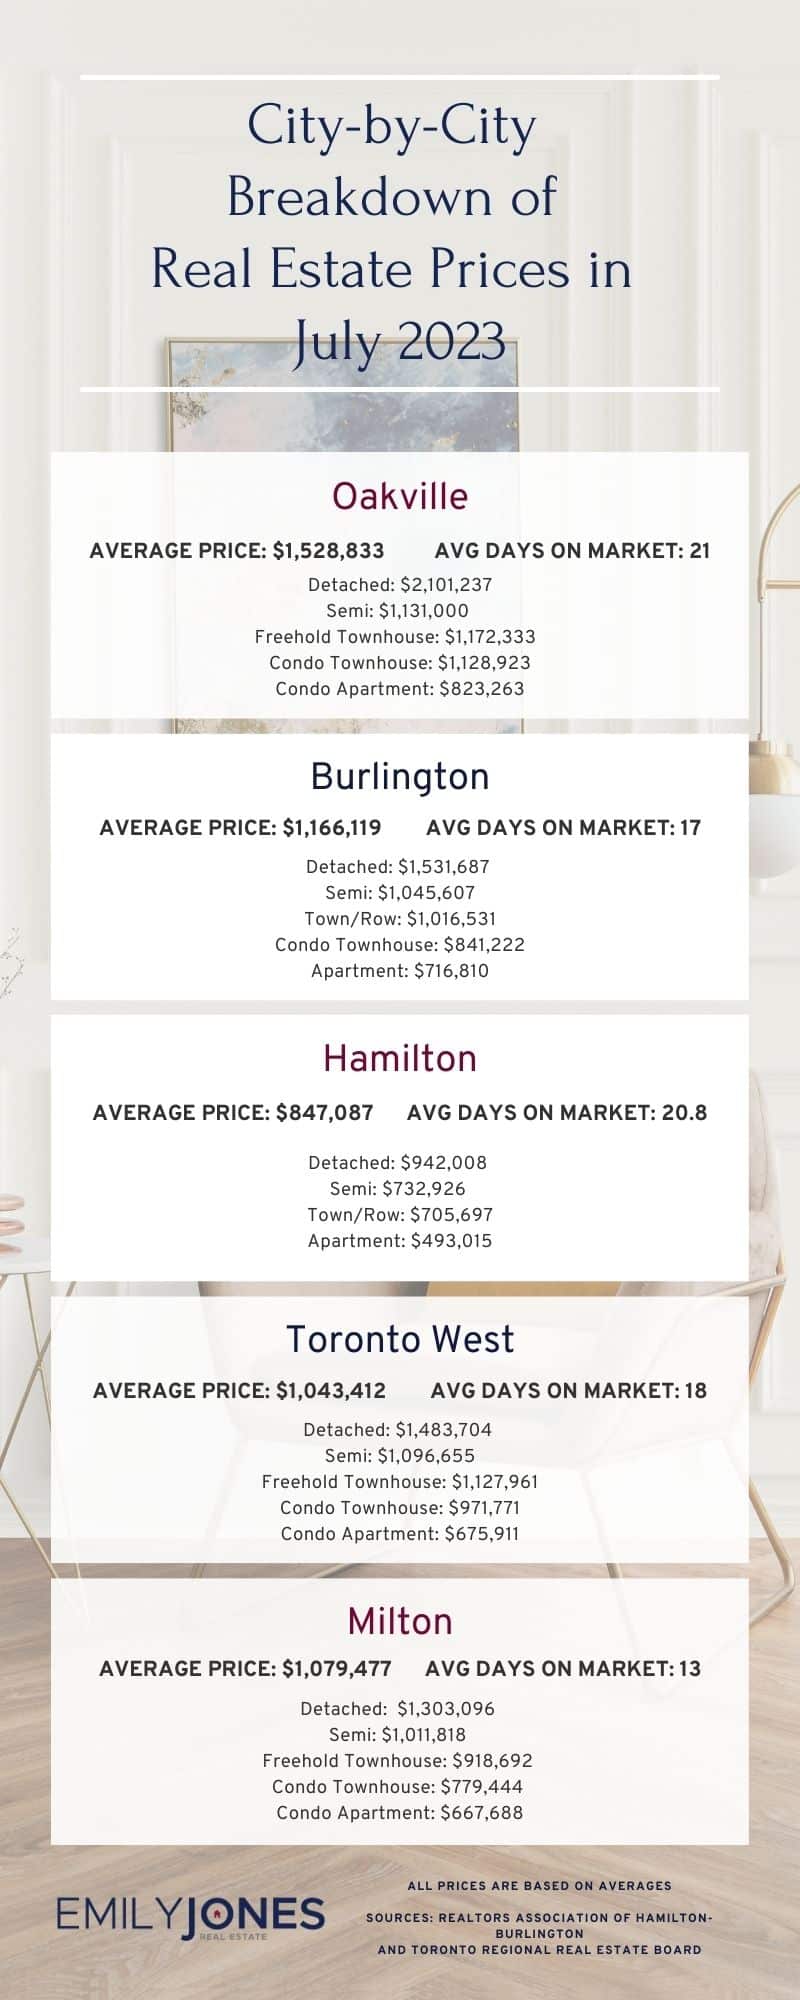
Burlington
Average Sale Price: $1,166,119 compared to $1,178,036 last month
Average Days on Market: 17 days
Detached: $1,531,687 (vs June 2023 $1,491,135)
Semi: $1,045,607 (vs June 2023 $1,099,303)
Town/Row: $1,016,531 (vs June 2023 $958,000)
Condo Townhouse: $841,222 (vs June 2023 $869,521)
Apartment: $716,810 (vs June 2023 $667,668)
Hamilton
Average Sale Price: $847,087 compared to $831,540 last month
Average Days on Market: 20.8 days
Detached: $942,008 (vs June 2023 $921,496)
Semi: $732,926 (vs June 2023 $730,894)
Town/Row: $705,697 (vs June 2023 $745,942)
Apartment: $493,015 (vs June 2023 $504,339)
Oakville
Average Sale Price: $1,528,833 compared to $1,568,200 last month
Average Days on Market: 21 days
Detached: $2,101,237 (vs June 2023 $2,140,659)
Semi: $1,131,000 (vs June 2023 $1,258,833)
Freehold Townhouse: $1,172,333 (vs June 2023$1,233,466)
Condo Townhouse: $1,128,923 (vs June 2023 $991,550)
Condo Apartment: $823,263 (vs June 2023 $791,898)
Mississauga
Average Sale Price: $1,057,640 compared to $1,112,531 last month
Overall Average Days on Market: 17 days
Detached: $1,530,510 (vs June 2023 $1,602,425)
Semi: $1,057,125 (vs June 2023 $1,105,754)
Freehold Townhouse: $1,061,618 (vs June 2023 $1,019,152)
Condo Townhouse: $806,425 (vs June 2023 $855,074)
Condo Apartment: $676,903 (vs June 2023 $636,012)
Toronto West
Average Sale Price: $1,043,412 compared to $1,080,772 last month
Average Days on Market: 18 days
Detached: $1,483,704 (vs June 2023 $1,521,700)
Semi: $1,096,655 (vs June 2023 $1,197,759)
Freehold Townhouse: $1,127,961 (vs June 2023 $1,170,787)
Condo Townhouse: $971,771 (vs June 2023 $837,098)
Condo Apartment: $675,911 (vs June 2023 $681,350)
Milton
Average Sale Price: $1,079,477 compared to $1,115,784 last month
Average Days on Market: 13 days
Detached: $1,303,096 (vs June 2023 $1,337,079)
Semi: $1,011,818 (vs June 2023 $1,046,371)
Freehold Townhouse: $918,692 (vs June 2023 $960,590)
Condo Townhouse: $779,444 (vs June 2023 $773,333)
Condo Apartment: $667,688 (vs June 2023 $607,750)
Sources for Real Estate Market Update for June 2023 : Toronto Regional Real Estate Board and REALTORS® Association of Hamilton-Burlington