
15 Aug Real Estate Market July 2022
There were 4,912 home sales reported through the Toronto Regional Real Estate Board (TRREB) MLS® System in July 2022 – down by 47% compared to July 2021. Following the regular seasonal trend, sales were also down compared to June. New listings also declined on a year-over-year basis in July, albeit down by a more moderate four%. The expectation is that the trend for new listings will continue to follow the trend for sales, as we move through the second half of 2022 and into 2023.
Market conditions remained much more balanced in July 2022 compared to a year earlier. As buyers continued to benefit from more choice, the annual rate of price growth has moderated. The MLS® Home Price Index (HPI) Composite Benchmark was up by 12.9% year-over-year. The average selling price was up by 1.2% compared to July 2021 to $1,074,754. Less expensive home types, including condo apartments, experienced stronger rates of price growth as more buyers turned to these segments to help mitigate the impact of higher borrowing costs.
“Many GTA households intend on purchasing a home in the future, but there is currently uncertainty about where the market is headed. Policymakers could help allay some of this uncertainty. As higher borrowing costs impact housing markets, TRREB maintains that the OSFI mortgage stress test should be reviewed in the current environment,” said TRREB CEO John DiMichele.
“With significant increases to lending rates in a short period, there has been a shift in consumer sentiment, not market fundamentals. The federal government has a responsibility to not only maintain confidence in the financial system, but to instill confidence in homeowners that they will be able to stay in their homes despite rising mortgage costs. Longer mortgage amortization periods of up to 40 years on renewals and switches should be explored,” said TRREB President Kevin Crigger.
Over in the Hamilton and Burlington areas, 811 sales of residential properties within the RAHB market area were reported in July 2022. Sales were down by 18.5% from June 2022 and down by 35.6% compared to July 2021. There were 1,783 new listings in July 2022, which was down 29.9% from June 2022, and compared to July 2021, there was an increase in listings of 18.6%. The average sale price for residential properties across the RAHB market area was $878,816, which was down 7.1% from June 2022, and up 3.9% compared to July 2021. There were 3.1 months of inventory* in July 2022 compared to 2.6 months in June 2022.
For a closer look at the numbers and a city-by-city breakdown by property type, take a look below:
Questions about buying or selling? Reach out anytime, I’d be happy to discuss the market with you!
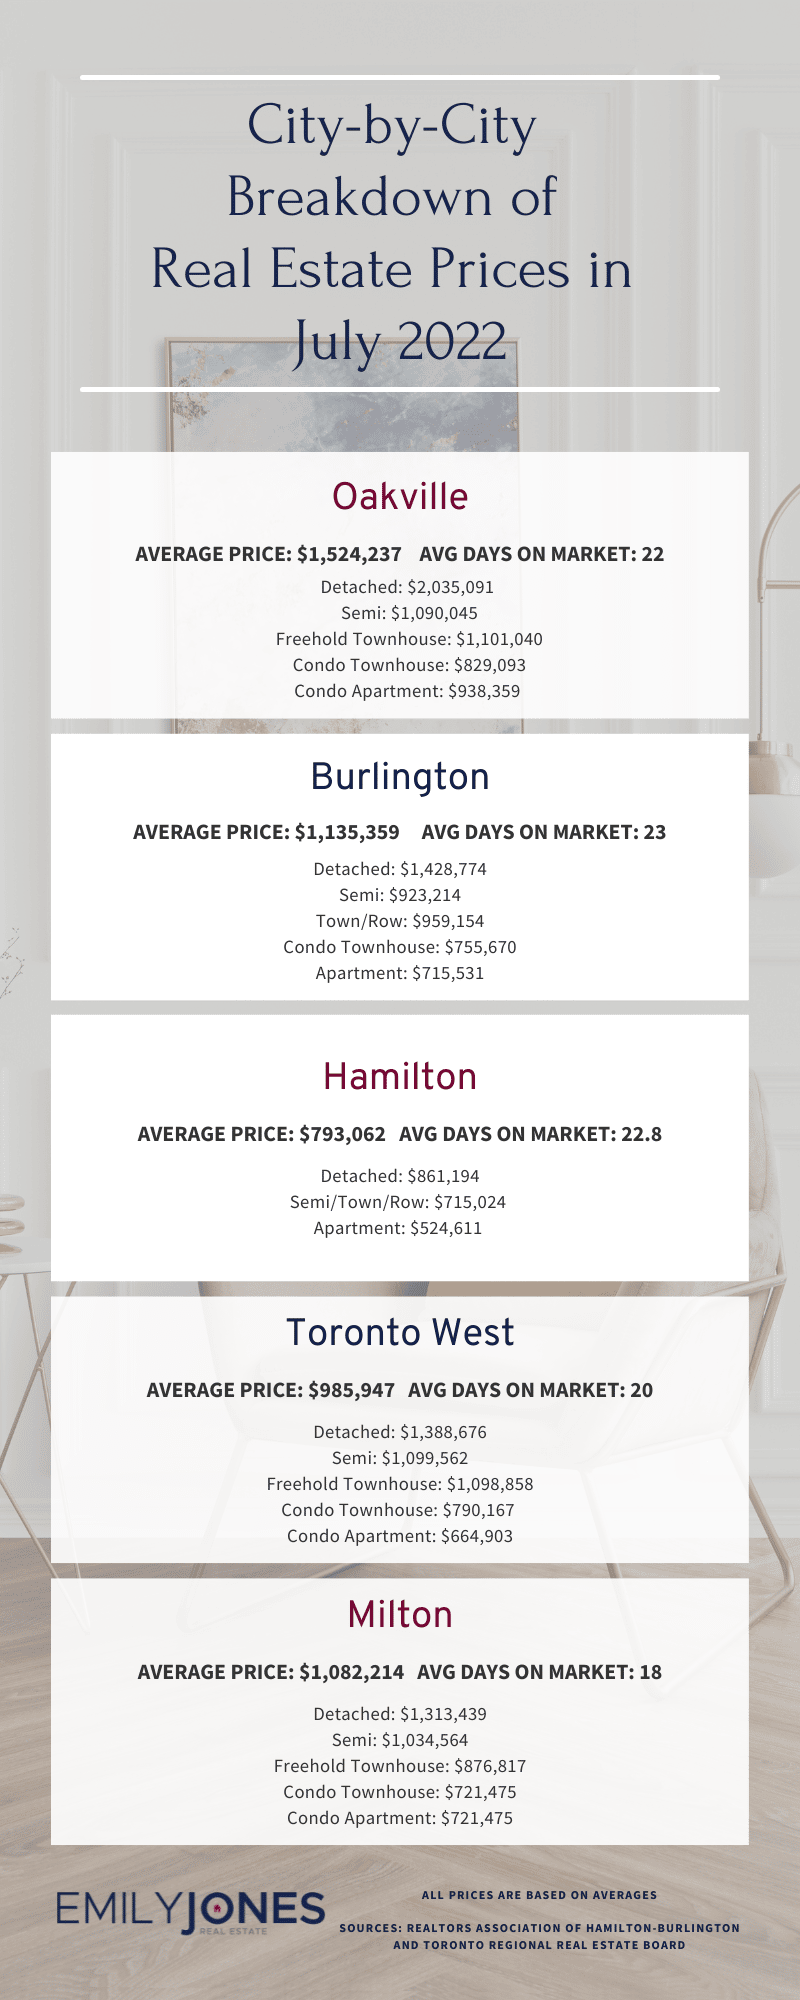
Burlington
Average Sale Price: $1,135,359 compared to $1,253,792 last month
Average Days on Market: 23 days
Detached: $1,428,774 (vs June 2022 $1,639,545)
Semi: $923,214 (vs June 2022 $957,350 )
Town/Row: $959,154 (vs June 2022 $954,250)
Condo Townhouse: $755,670 (vs June 2022 $771,261)
Apartment: $715,531 (vs June 2022 $644,021)
Hamilton
Average Sale Price: $793,062 compared to $863,016 last month
Down about 22% since Feb 2022 (peak)
Average Days on Market: 22.8 days
Detached: $861,194 (vs June 2022 $949,730)
Semi/Town/Row: $715,024 (vs June 2022$752,874)
Apartment: $524,611 (vs June 2022 $529,014)
Oakville
Average Sale Price: $1,524,237 compared to $1,436,709 last month
Average Days on Market: 22 days
Detached: $2,035,091 (vs June 2022 $1,927,887)
Semi: $1,090,045 (vs June 2022 $1,132,559)
Freehold Townhouse: $1,101,040 (vs June 2022 $1,202,547)
Condo Townhouse: $829,093 (vs June 2022 $867,240)
Condo Apartment: $938,359 (vs June 2022 $847,250)
Mississauga
Average Sale Price: $1,068,804 compared to $1,093,743 last month
Overall Average Days on Market: 20 days
Detached: $1,589,123 (vs June 2022 $1,605,497)
Semi: $982,556 (vs June 2022 $1,058,101)
Freehold Townhouse: $1,005,494 (vs June 2022 $1,092,741)
Condo Townhouse: $798,552 (vs June 2022 $819,176)
Condo Apartment: $628,116 (vs June 2022 $659,539)
Toronto West
Average Sale Price: $985,947 compared to $1,121,743 last month
Average Days on Market: 20 days
Detached: $1,388,676 (vs June 2022 $1,577,412)
Semi: $1,099,562 (vs June 2022 $1,157,806)
Freehold Townhouse: $1,098,858 (vs June 2022 $1,136,261)
Condo Townhouse: $790,167 (vs June 2022 $827,385)
Condo Apartment: $664,903 (vs June 2022 $719,870)
Milton
Average Sale Price: $1,082,214 compared to $1,101,868 last month
Average Days on Market: 18 days
Detached: $1,313,439 (vs June 2022 $1,352,357)
Semi: $1,034,564 (vs June 2022 $1,032,915)
Freehold Townhouse: $876,817 (vs June 2022 $943,575)
Condo Townhouse: $721,475 (vs June 2022 $731,778)
Condo Apartment: $721,475 (vs June 2022 $665,647)
Sources for Real Estate Market Update for July 2022 : Toronto Regional Real Estate Board and REALTORS® Association of Hamilton-Burlington