
15 Feb Real Estate Market January 2024
Your January 2024 real estate market update is here! Covering Toronto, Oakville, Burlington, Hamilton and the surrounding areas.
Highlights of the real estate market from TREBB and RAHB
Home sales were up in January 2024 in comparison to January 2023. This annual increase came as some homebuyers started to benefit from lower borrowing costs associated with fixed rate mortgage products. New listings were also up year-over-year but by a lesser annual rate compared to sales. The resulting tighter market conditions when compared to the same period a year earlier, potentially points toward renewed price growth as we move into the spring market.
“We had a positive start to 2024. The Bank of Canada expects the rate of inflation to recede as we move through the year. This would support lower interest rates which would bolster home buyers’ confidence to move back into the market. First-time buyers currently facing high average rents would benefit from lower mortgage rates, making the move to homeownership more affordable,” said TRREB President Jennifer Pearce.
There were 4,223 sales reported through TRREB’s MLS® System in January 2024 – an increase of more than one-third compared to January 2022. The number of new listings was also up year-over-year but by a lesser annual rate of approximately 6%. Stronger sales growth relative to listings suggests buyers experienced tighter market conditions compared to a year ago. On a month-over-month seasonally adjusted basis, both sales and new listings were up. Sales increased more than listings which means market conditions tightened relative to December 2023.
“Once the Bank of Canada actually starts cutting its policy rate, likely in the second half of 2024, expect home sales to pick up even further. There will be more competition between buyers in 2024 as demand picks up and the supply of listings remains constrained. The end result will be upward pressure on selling prices over the next two years,” said TRREB Chief Market Analyst Jason Mercer.
The MLS® Home Price Index Composite in January 2024 was down by less than 1% year-over-year in January. The average selling price was down by 1% year-over-year to $1,026,703. On a month-over-month seasonally adjusted basis, both the MLS® HPI Composite and the average selling price also trended lower.
Over in the Hamilton-Burlington area, the 608 sales are slightly higher than levels reported last year, as gains in detached and semidetached sales offset the declines in apartment and row-style homes. Meanwhile, inventory levels slowed compared to those seen at the end of 2023 but are 11% higher than those reported a year earlier.
The year-over-year gains in inventory was mostly offset by the gains in sales and the months of supply remained relatively stable compared to the previous year. Inventories are higher than reported in the past decade; however, they are more consistent with what was reported in the region before 2014. “It is not a surprise that sales remained below long-term trends, given higher interest rates. And while inventory levels are also higher, they are still considered low when you look beyond the past decade that struggled with low inventory,” says Nicolas von Bredow, President of the REALTORS® Association of Hamilton-Burlington (RAHB).
The benchmark price in January totalled $809,600 in the region, slightly higher than last month. While overall prices have not changed much, we have seen variations based on location and property types. The region’s relatively tighter market conditions in Hamilton and Burlington kept home prices stable. At the same time, higher months of supply in Haldimand and Niagara North contributed to modest declines in price.
Questions about buying or selling? Reach out anytime, I’d be happy to discuss the market with you!
All the latest home prices and statistics by property type and city below!
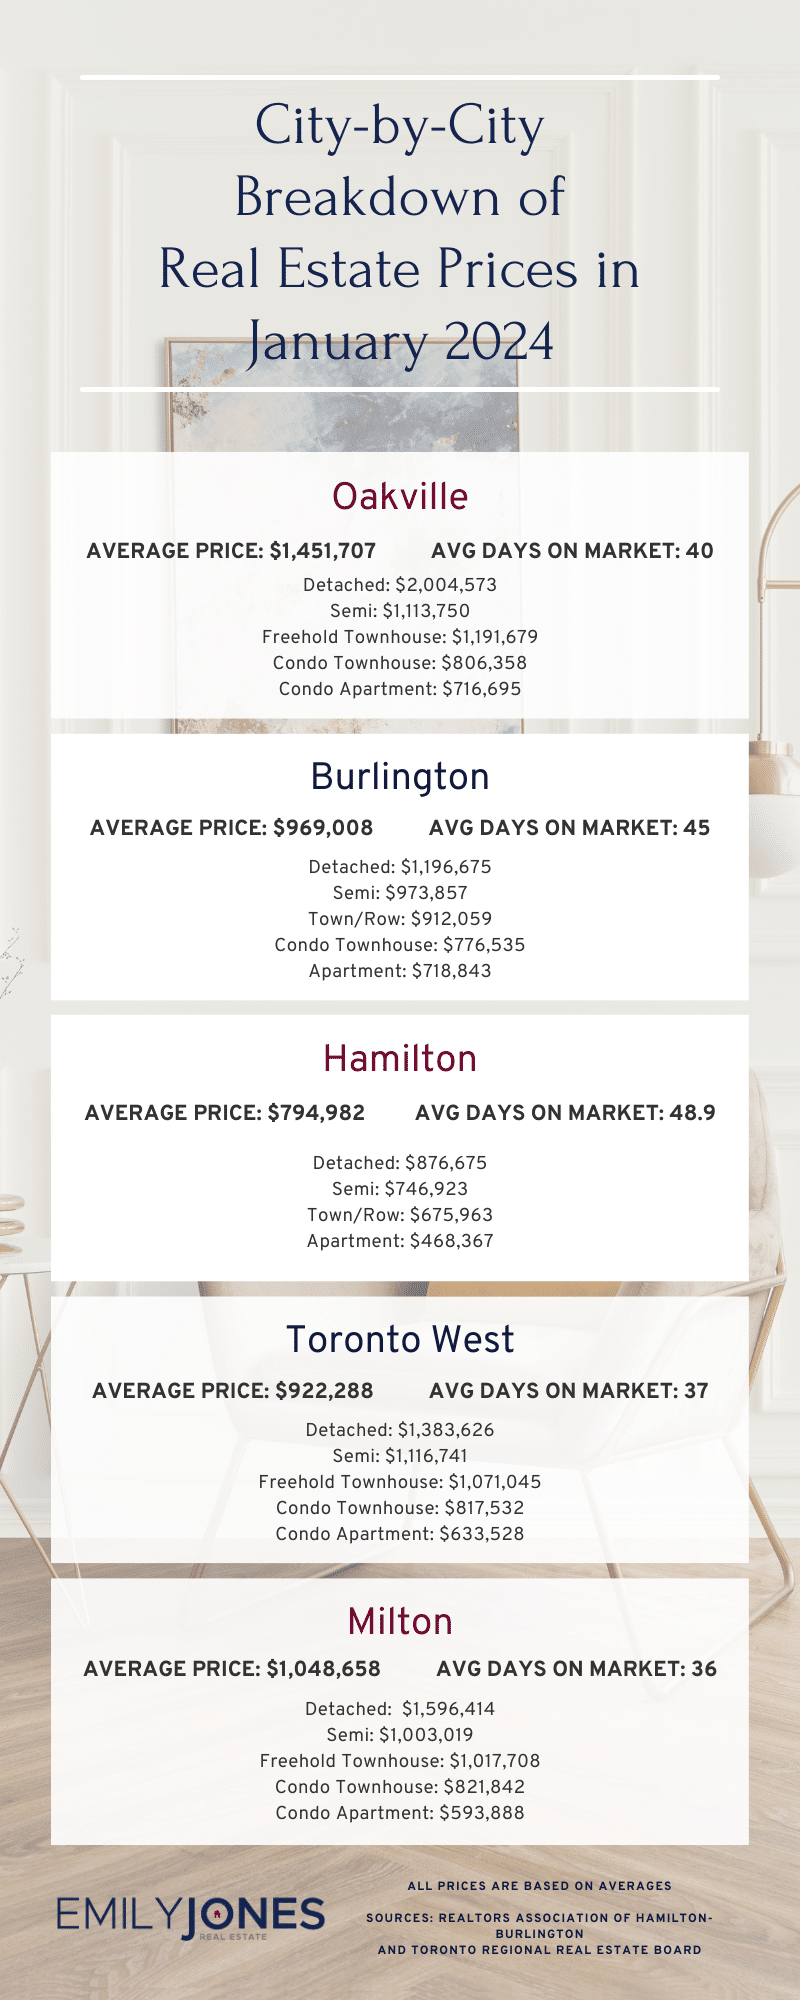
Burlington
Average Sale Price: $969,008 compared to $1,016,778 last month
Average Days on Market: 45 days
Detached: $1,196,675 (vs Dec 2023 $1,265,746)
Semi: $973,857 (vs Dec 2023 $951,900)
Town/Row: $912,059 (vs Dec 2023 $890,636)
Condo Townhouse: $776,535 (vs Dec 2023 $894,833)
Apartment: $718,843 (vs Dec 2023 $587,519)
Hamilton
Average Sale Price: $794,982 compared to $760,376 last month
Average Days on Market: 48.9 days
Detached: $876,675 (vs Dec 2023 $822,354)
Semi: $746,923 (vs Dec $668,039)
Town/Row: $675,963 (vs Dec 2023 $667,709)
Apartment: $468,367 (vs Dec 2023 $428,524)
Oakville
Average Sale Price: $1,451,707 compared to $1,630,068 last month
Average Days on Market: 40 days
Detached: $2,004,573 (vs Dec 2023 $2,227,824)
Semi: $1,113,750 (vs Dec 2023 $1,485,329)
Freehold Townhouse: $1,191,679 (vs Dec 2023 $1,188,425)
Condo Townhouse: $806,358 (vs Dec 2023 $705,186)
Condo Apartment: $716,695 (vs Dec 2023 $718,949)
Mississauga
Average Sale Price: $1,048,658 compared to $951,608 last month
Overall Average Days on Market: 36 days
Detached: $1,596,414 (vs Dec 2023 $1,355,241)
Semi: $1,003,019 (vs Dec 2023 $949,876)
Freehold Townhouse: $1,017,708 (vs Dec 2023 $922,683)
Condo Townhouse: $821,842 (vs Dec 2023 $773,047)
Condo Apartment: $593,888 (vs Dec 2023 $610,964)
Toronto West
Average Sale Price: $922,288 compared to $998,532 last month
Average Days on Market: 37 days
Detached: $1,383,626 (vs Dec 2023 $1,430,164)
Semi: $1,116,741 (vs Dec 2023 $1,020,514)
Freehold Townhouse: $1,071,045 (vs Dec 2023 $1,121,600)
Condo Townhouse: $817,532 (vs Dec 2023 $752,176)
Condo Apartment: $633,528 (vs Dec 2023 $619,919)
Milton
Average Sale Price: $1,033,641 compared to $990,944 last month
Average Days on Market: 33 days
Detached: $1,274,544 (vs Dec 2023 $1,249,388)
Semi: $1,043,889 (vs Dec 2023 $931,833)
Freehold Townhouse: $868,341 (vs Dec 2023 $867,557)
Condo Townhouse: $644,167 (vs Dec 2023 $685,000)
Condo Apartment: $631,833 (vs Dec 2023 $586,564)
Sources for Real Estate Market Update for January 2024 : Toronto Regional Real Estate Board and REALTORS® Association of Hamilton-Burlington