
06 Feb Real Estate Market January 2023
Your January 2023 real estate market update is here! Covering Toronto, Oakville, Burlington, Hamilton and the surrounding areas.
Highlights of the real estate market from TREBB and RAHB
The Greater Toronto Area (GTA) housing market saw a similar number of sales and average selling price in January similar to last month. On a year-over-year basis, both sales and prices were down markedly, continuing to highlight the impact of higher borrowing costs on affordability over the last year.
“Home sales and selling prices appear to have found some support in recent months. This coupled with the Bank of Canada announcement that interest rate hikes are likely on hold for the foreseeable future will prompt some buyers to move off the sidelines in the coming months. Record population growth and tight labour market conditions will continue to support housing demand moving forward,” said Toronto Regional Real Estate Board (TRREB) President Paul Baron.
GTA REALTORS® reported 3,100 sales through TRREB’s MLS® System in January 2023 – in line with the December 2022 result of 3,110, but down 44.6% from January 2022. The average selling price for January 2023 at $1,038,668 was slightly lower than the December 2022 result and down by 16.4% compared to the January 2022 average. The MLS® Home Price Index (HPI) Composite Benchmark was in line with the December result, but down by 14.2% compared to January 2022.
“Home prices declined over the past year as homebuyers sought to mitigate the impact of substantially higher borrowing costs. While short-term borrowing costs increased again in January, negotiated medium-term mortgage rates, like the five-year fixed rate, have actually started to trend lower compared to the end of last year. The expectation is that this trend will continue, further helping with affordability as we move through 2023,” said TRREB Chief Market Analyst Jason Mercer.
Over in Hamilton, the REALTORS® Association of Hamilton-Burlington (RAHB) market area is seeing inventory levels comparable to what we saw pre-pandemic. This is likely due to higher interest rates and a rise in new listings hitting the market. Inventory has increased across all price points, particularly the lower price ranges. The new year has shown an increase in sales of homes priced under $800,000 and supply options in that price range are better compared to last January. However, total home sales are down 26% year over year.
Currently, we have a little less than a three-month supply of market inventory. While conditions are not as tight as they have been the past several years, we are also not dealing with the oversupply scenario we faced during the financial crisis. This will likely limit how much prices adjust from recent highs.
Across the RAHB market area, home prices are 20% lower than they were at the start of 2022. However, after ten months of consecutive declines, benchmark prices increased over December. The unadjusted benchmark price was $809,800, below the $1,012,700 reported in January 2022, but well above the $602,700 reported at the beginning of the pandemic in 2020. This could potentially reflect a stabilization in prices.
Questions about buying or selling? Reach out anytime, I’d be happy to discuss the market with you!
All the latest home prices and statistics by property type and city below!
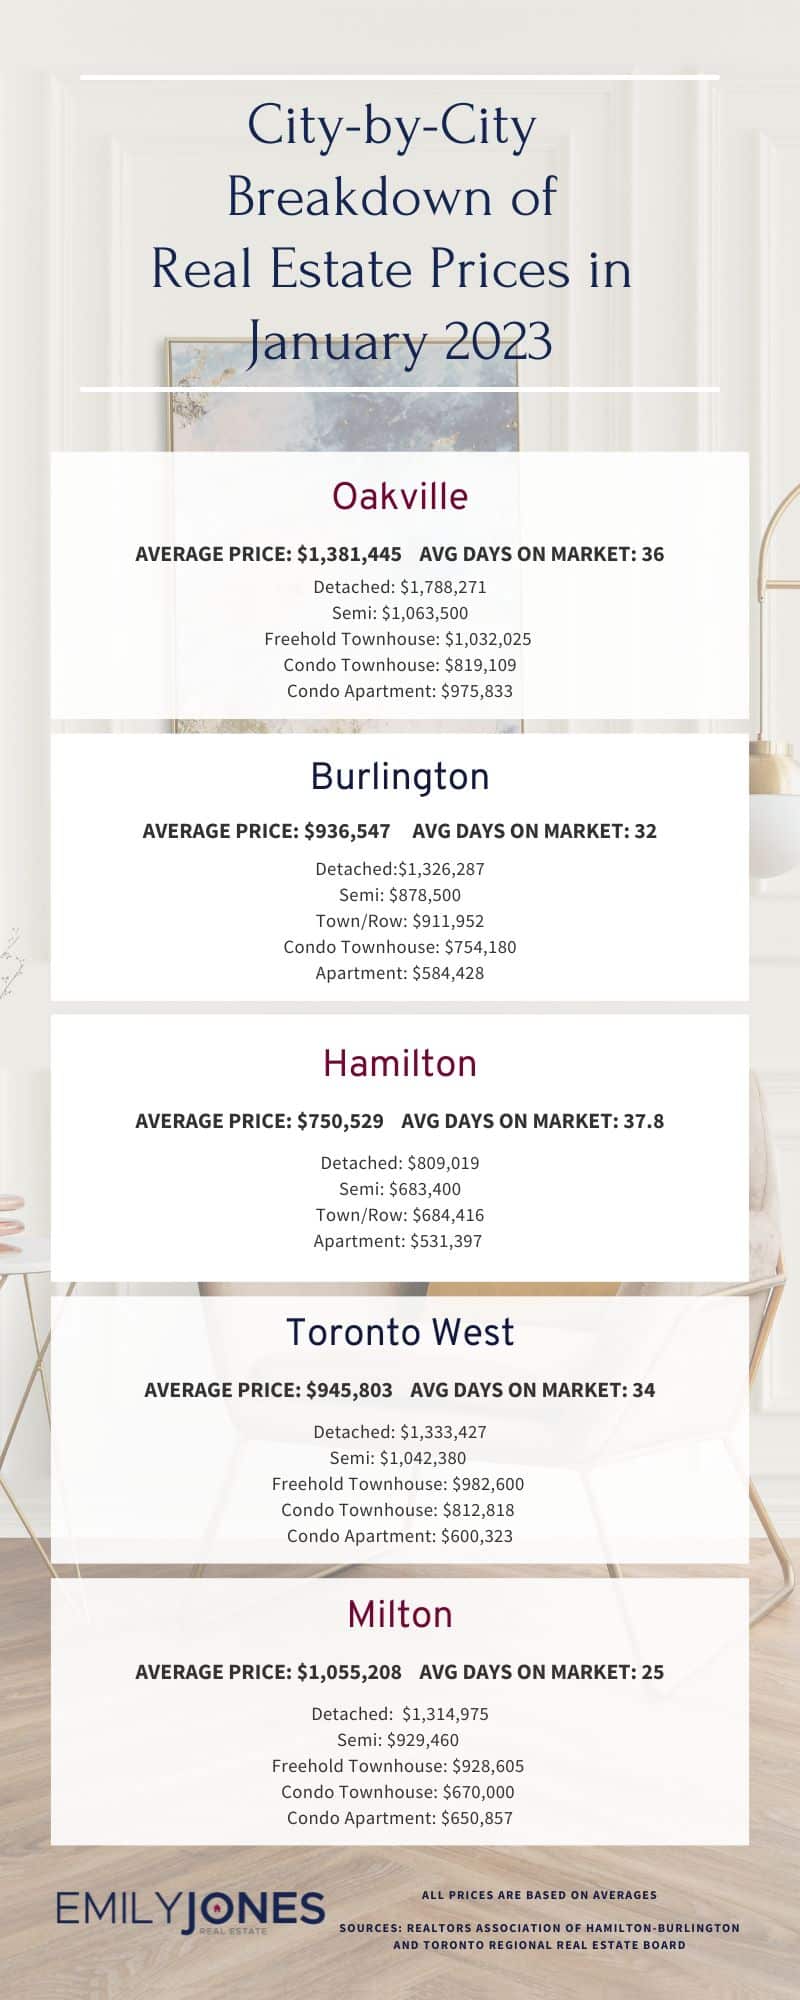
Burlington
Average Sale Price: $936,547 compared to $1,070,036 last month
Average Days on Market: 32 days
Detached: $1,326,287 (vs Dec 2022 $1,474,348)
Semi: $878,500 (vs Nov 2022 $908,666, there was no Dec stat)
Town/Row: $911,952 (vs Dec 2022 $940,143)
Condo Townhouse: $754,180 (vs Dec 2022 $771,706)
Apartment: $584,428 (vs Dec 2022 $579,183, this marks 3 months of consecutive but slight growth)
Hamilton
Average Sale Price: $750,529 compared to $750,601 last month
Average Days on Market: 37.8 days
Detached: $809,019 (vs Dec 2022 $817,515)
Semi: $683,400 (vs Dec 2022 $699,300)
Town/Row: $684,416 (vs Dec 2022 $663,623)
Apartment: $531,397 (vs Dec 2022 $471,463)
Oakville
Average Sale Price: $1,381,445 compared to $1,449,722 last month
Average Days on Market: 36 days
Detached: $1,788,271 (vs Dec 2022 $1,821,049)
Semi: $1,063,500 (vs Dec 2022 $1,033,600)
Freehold Townhouse: $1,032,025 (vs Dec 2022 $1,064,350)
Condo Townhouse: $819,109 (vs Dec 2022 $775,750)
Condo Apartment: $975,833 (vs Dec 2022 $922,750)
Mississauga
Average Sale Price: $920,587 compared to $977,016 last month
Overall Average Days on Market: 30 days
Detached: $1,379,588 (vs Dec 2022 $1,464,493)
Semi: $960,178 (vs Dec 2022 $964,661)
Freehold Townhouse: $1,045,429 (vs Dec 2022 $982,375)
Condo Townhouse: $797,702 (vs Dec 2022 $776,448)
Condo Apartment: $626,401 (vs Dec 2022 $612,597)
Toronto West
Average Sale Price: $945,803 compared to $967,766 last month
Average Days on Market: 34 days
Detached: $1,333,427 (vs Dec 2022 $1,336,662)
Semi: $1,042,380 (vs Dec 2022 $1,022,250)
Freehold Townhouse: $982,600 (vs Dec 2022 $1,024,250)
Condo Townhouse: $812,818 (vs Dec 2022 $768,981)
Condo Apartment: $600,323 (vs Dec 2022 $670,089)
Milton
Average Sale Price: $1,055,208 compared to $1,069,068 last month
Average Days on Market: 25 days
Detached: $1,314,975 (vs Dec 2022 $1,361,618)
Semi: $929,460 (vs Dec 2022 $1,015,367)
Freehold Townhouse: $928,605 (vs Dec 2022 $869,438)
Condo Townhouse: $670,000 (vs Dec 2022 $691,250)
Condo Apartment: $650,857 (vs Dec 2022 $617,839)
Sources for Real Estate Market Update for January 2023 : Toronto Regional Real Estate Board and REALTORS® Association of Hamilton-Burlington