
08 Mar Real Estate Market February 2024
Your February 2024 real estate market update is here! Covering Toronto, Oakville, Burlington, Hamilton and the surrounding areas.
Highlights of the real estate market from TREBB and RAHB
Greater Toronto Area (GTA) home sales and new listings were up on an annual and monthly basis in February 2024. Selling prices also edged upward compared to a year earlier. Population growth and a resilient regional economy continued to support the overall demand for housing. Higher borrowing costs kept home sales below the February sales record reached in 2021.
“We have recently seen a resurgence in sales activity compared to last year. The market assumption is that the Bank of Canada has finished hiking rates. Consumers are now anticipating rate cuts in the near future. A growing number of homebuyers have also come to terms with elevated mortgage rates over the past two years. To minimize higher monthly payments, some buyers have likely saved up a larger down payment, chosen to purchase a less-expensive home type and/or looked to a different location in the GTA,” said TRREB President Jennifer Pearce.
REALTORS® reported 5,607 GTA home sales through TRREB’s MLS® System in February 2024 – an increase of 17.9% compared to February 2023. Even after accounting for the leap year effect, sales were up by 12.3% year-over-year. New listings were up by an even greater annual rate than sales in February, pointing to increased choice for buyers. On a seasonally adjusted month-over-month basis, February sales were lower following two consecutive monthly increases while new listings were flat. Monthly figures can be somewhat volatile, especially when the market is approaching a transition point.
Home selling prices in February 2024 remained similar to February 2023. The MLS® Home Price Index Composite benchmark edged up by 0.4%. The average selling price of $1,108,720 increased by a modest 1.1%. On a seasonally-adjusted monthly basis, both the MLS® HPI Composite and the average selling price edged upward. “As we move through 2024, an increasing number of buyers will re-enter the market with adjusted housing preferences to account for higher borrowing costs. In the second half of the year, lower interest rates will further boost demand for ownership housing. First-time buying activity will also be a contributing factor, as many renters look to trade high monthly
rents for a long-term investment in which they can live and build equity,” said TRREB Chief Market Analyst Jason Mercer.
Over in the Hamilton-Burlington area, February sales reached 839 units, a modest gain compared to last year. While the leap year provided an additional day of activity, it did not impact Haldimand County, where sales activity slowed compared to the previous year. However, substantial gains were reported in Niagara North and Burlington, offsetting the pullbacks in Haldimand. Year-to-date sales are 9% higher than last but 16% below long-term trends.
A total of 1,489 new units were listed in February, which is slightly higher than long-term trends. However, levels were nearly 23% higher compared to last year. The sales-to-new listings ratio was 56%, which helped boost inventory levels over the previous month. Inventory levels were nearly 18% higher than last year. Supply improved across almost every price range in the total region. “While supply gains may seem significant, it is important to remember that we have generally seen lower resale supply levels in our market for nearly a decade. At the same time, we are starting to see improvements in sales, keeping our market relatively balanced with over two months of supply and a sales-to-new listings ratio of 57%,” says Nicolas von Bredow, President of the REALTORS® Association of Hamilton-Burlington (RAHB).
In line with typical seasonal behaviour, the unadjusted benchmark price trended up over the previous month, reaching $835,900. Overall prices are relatively stable compared to levels reported at the start of last year. The benchmark price in January totalled $809,600 in the region, slightly higher than last month. While overall prices have not changed much, we have seen variations based on location and property types. The region’s relatively tighter market conditions in Hamilton and Burlington kept home prices stable. At the same time, higher months of supply in Haldimand and Niagara North contributed to modest declines in price.
Questions about buying or selling? Reach out anytime, I’d be happy to discuss the market with you!
All the latest home prices and statistics by property type and city below!
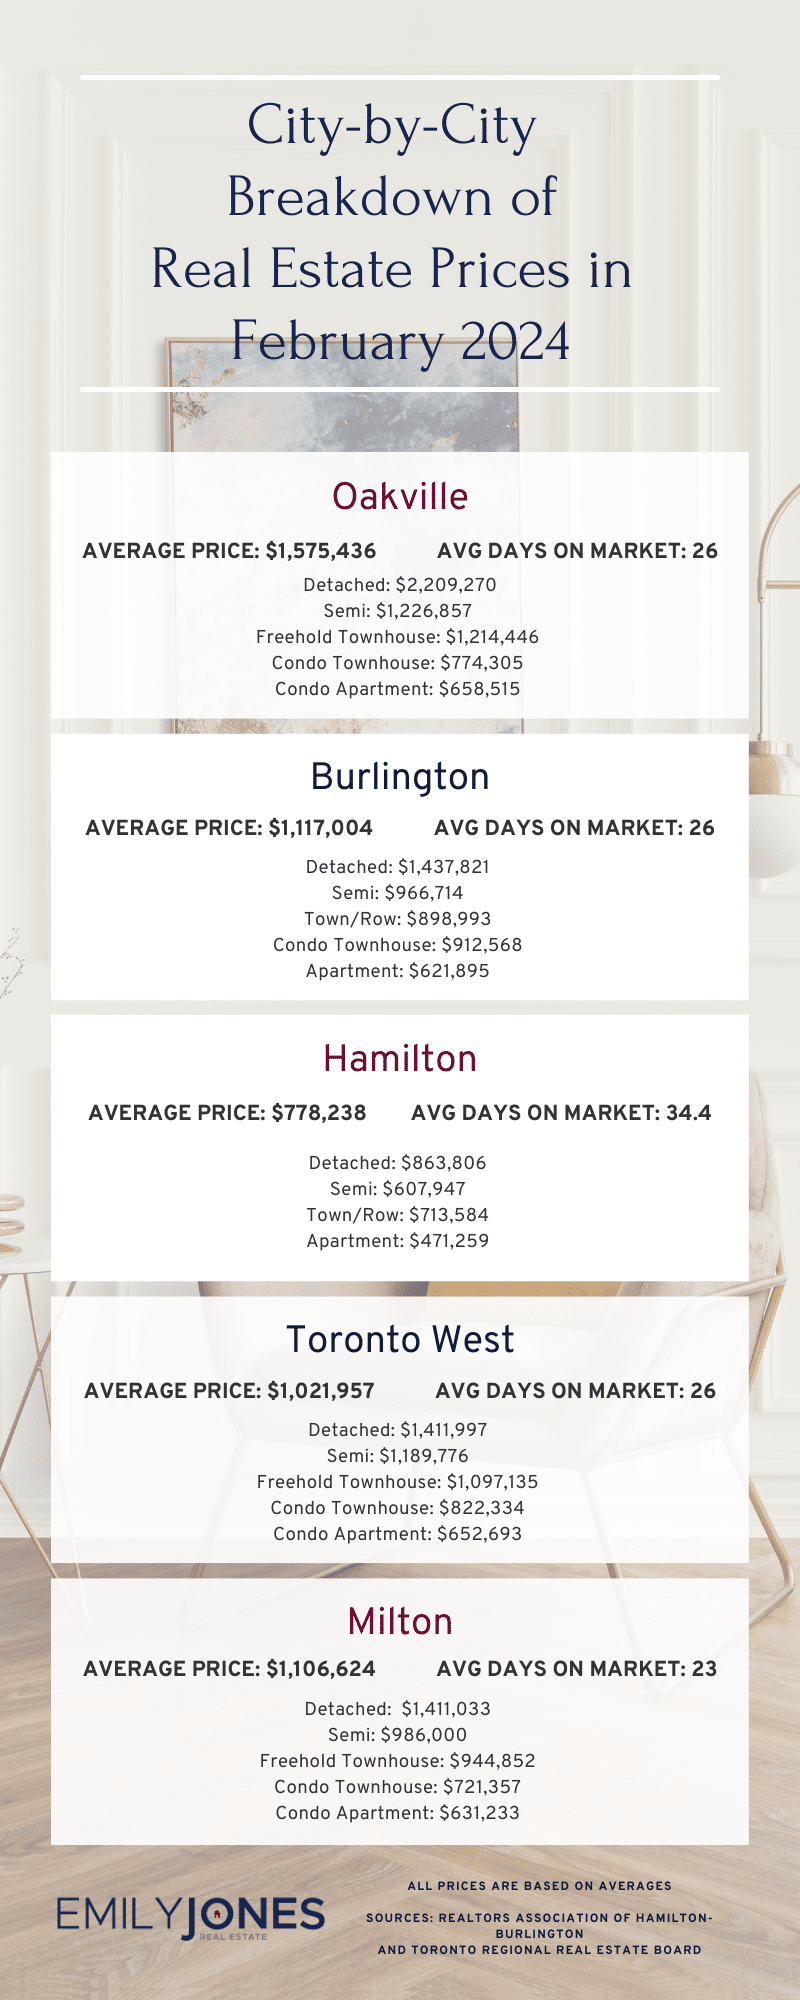
Burlington
Average Sale Price: $1,117,004 compared to $969,008 last month
Average Days on Market: 26 days
Detached: $1,437,821 (vs Jan 2024 $1,196,675)
Semi: $966,714 (vs Jan 2024 $973,857)
Town/Row: $898,993 (vs Jan 2024 $912,059)
Condo Townhouse: $912,568 (vs Jan 2024 $776,535)
Apartment: $621,895 (vs Jan 2024 $718,843)
Hamilton
Average Sale Price: $778,238 compared to $794,982 last month
Average Days on Market: 34.4 days
Detached: $863,806 (vs Jan 2024 $876,675)
Semi: $607,947 (vs Jan 2024 $746,923)
Town/Row: $713,584 (vs Jan 2024 $675,963 )
Apartment: $471,259 (vs Jan 2024 $468,367)
Oakville
Average Sale Price: $1,575,436 compared to $1,451,707 last month
Average Days on Market: 26 days
Detached: $2,209,270 (vs Jan 2024 $2,004,573)
Semi: $1,226,857 (vs Jan 2024 $1,113,750)
Freehold Townhouse: $1,214,446 (vs Jan 2024 $1,191,679)
Condo Townhouse: $774,305 (vs Jan 2024 $806,358)
Condo Apartment: $658,515 (vs Jan 2024 $716,695)
Mississauga
Average Sale Price: $996,259 compared to $1,048,658 last month
Overall Average Days on Market: 26 days
Detached: $1,498,421 (vs Jan 2024 $1,596,414)
Semi: $1,071,397 (vs Jan 2024 $1,003,019)
Freehold Townhouse: $1,123,342 (vs Jan 2024 $1,017,708)
Condo Townhouse: $802,849 (vs Jan 2024 $821,842)
Condo Apartment: $630,583 (vs Jan 2024 $593,888)
Toronto West
Average Sale Price: $1,021,957 compared to $922,288 last month
Average Days on Market: 26 days
Detached: $1,411,997 (vs Jan 2024 $1,383,626)
Semi: $1,189,776 (vs Jan 2024 $1,116,741)
Freehold Townhouse: $1,097,135 (vs Jan 2024 $1,071,045)
Condo Townhouse: $822,334 (vs Jan 2024 $817,532)
Condo Apartment: $652,693 (vs Jan 2024 $633,528)
Milton
Average Sale Price: $1,106,624 compared to $1,033,641 last month
Average Days on Market: 23 days
Detached: $1,411,033 (vs Jan 2024 $1,274,544)
Semi: $986,000 (vs Jan 2024 $1,043,889)
Freehold Townhouse: $944,852 (vs Jan 2024 $868,341)
Condo Townhouse: $721,357 (vs Jan 2024 $644,167)
Condo Apartment: $631,233 (vs Jan 2024 $631,833)
Sources for Real Estate Market Update for February 2024 : Toronto Regional Real Estate Board and REALTORS® Association of Hamilton-Burlington