
20 Mar Real Estate Market February 2023
Your February 2023 real estate market update is here! Covering Toronto, Oakville, Burlington, Hamilton and the surrounding areas.
Highlights of the real estate market from TREBB and RAHB
February sales in the Greater Toronto Area (GTA) were down substantially from the pre-rate hike levels of early 2022. However, the number of new listings also dropped substantially year-over-year. The result was that the average selling price and MLS® HPI continued to level off after trending lower through the spring and summer of last year.
“It has been almost a year since the Bank of Canada started raising interest rates. Home prices have dropped over the last year from the record peak in February 2022, mitigating the impact of higher borrowing costs. Many homebuyers have also decided to purchase a lower priced home to help offset higher borrowing costs. The share of home purchases below one million dollars is up substantially compared to this time last year,” said Toronto Regional Real Estate Board (TRREB) President Paul Baron.
GTA REALTORS® reported 4,783 sales through TRREB’s MLS® System in February 2023 – down 47% compared to February 2022, the last full month before the onset of interest rate hikes. The number of new listings entered into the system was down by a similar annual rate of 40.9% to 8,367.
“New listings continued to drop year-over-year in the GTA. Recently released Ipsos polling suggests buying intentions have picked up for 2023. This increased demand will run up against a constrained supply of listings and lead to increased competition between buyers. This will eventually lead to renewed price growth in many segments of the market, especially those catering to first-time buyers facing increased rental costs,” said TRREB Chief Market Analyst Jason Mercer.
The average selling price for February 2023 was $1,095,617 – down 17.9% compared to February 2022. Some of this decline is attributable to the fact that the share of sales below $1,000,000 was 57% in February 2023 versus only 38% a year earlier. On a monthly basis, the average price followed the regular seasonal trend, increasing relative to January 2023.
Over in Hamilton, the REALTORS® Association of Hamilton-Burlington (RAHB) market area saw 765 sales in February, 37% less than the same time the previous year. Much of the decline was felt in the higher end of the market. Homes priced below $800,000 represented the majority of sales.
“Demand at the lower end of the market is increasing as higher interest rates impact affordability and attainability. Buyers have more options than they did a year ago and are less likely to compete in unfavourable market conditions,” said Lou Piriano, RAHB President. “Sellers at the high end of the market appear reluctant to sell, presumably because to move and take on a new mortgage rate could equal a higher monthly payment.”
An increased hesitancy to list impacted the detached sector hardest. New listings fell to 1,203 in February, 27% below the same time last year, and new listings relative to sales prevented significant inventory gains. While inventory levels are much higher than reported last year, they are still below levels reported for this time of year before the pandemic.
For the second month in a row, unadjusted benchmark prices trended up over the previous month. This may indicate that prices are starting to stabilize. Prices in February 2022 were perhaps the most competitive of all time. This February, sales were over 22% below last year.
Questions about buying or selling? Reach out anytime, I’d be happy to discuss the market with you!
All the latest home prices and statistics by property type and city below!
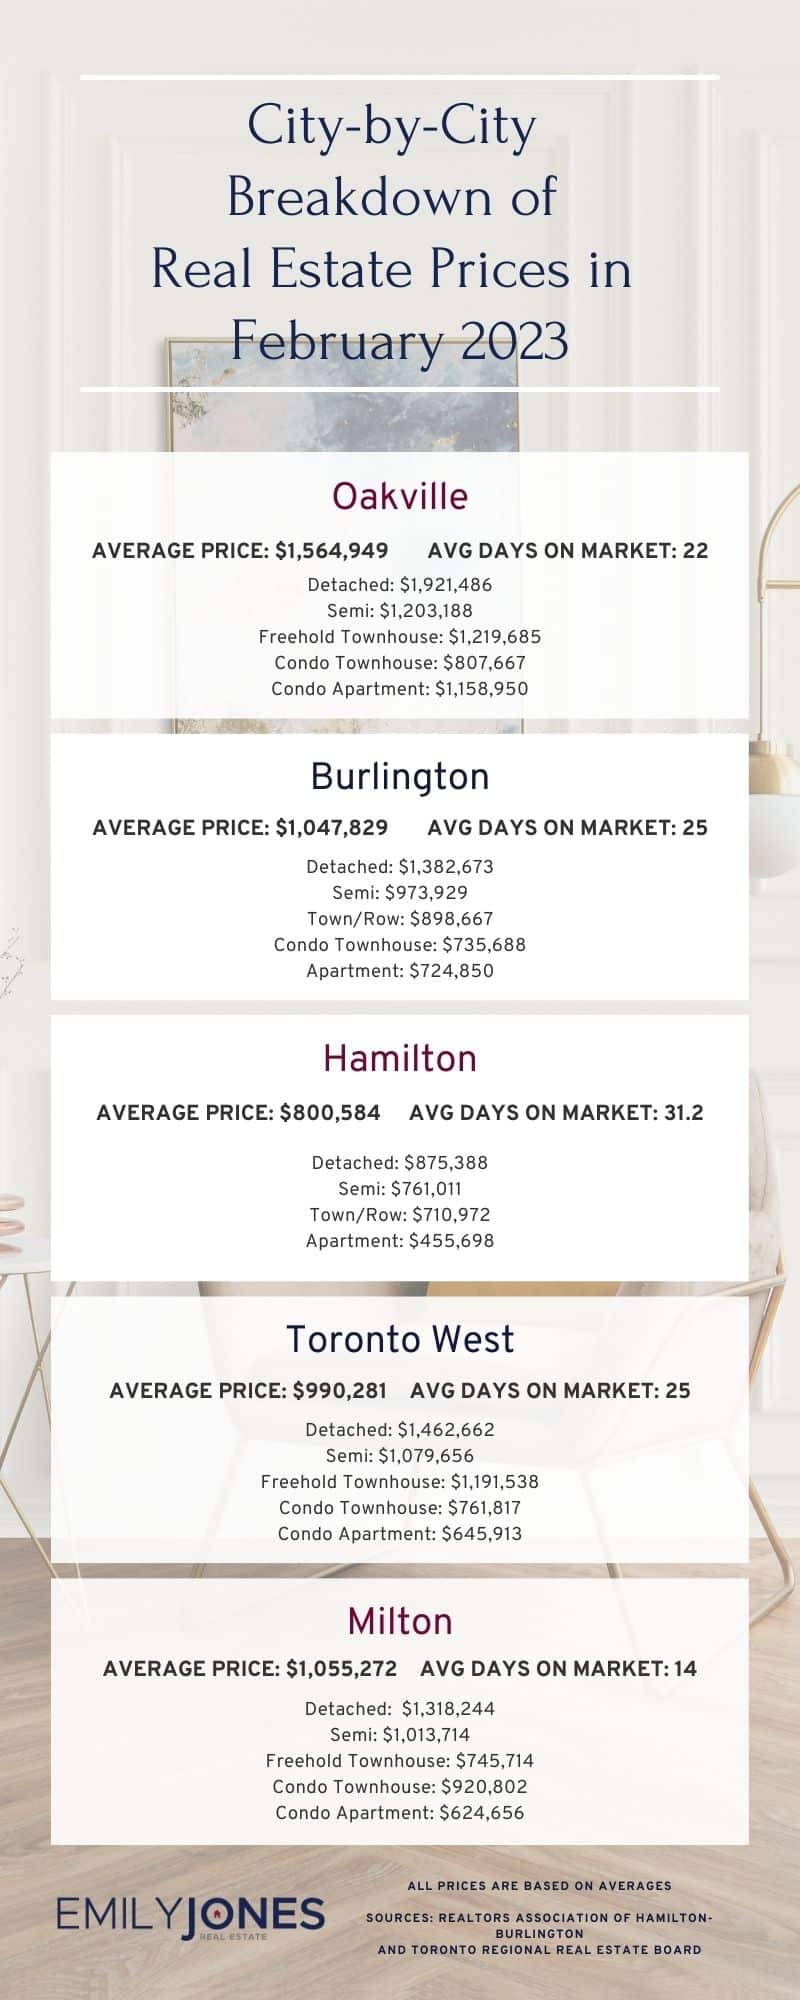
Burlington
Average Sale Price: $1,047,829 compared to $936,547 last month
Average Days on Market: 25 days
Detached: $1,382,673 (vs Jan 2023 $1,326,287)
Semi: $973,929 (vs Jan 2023 $878,500)
Town/Row: $898,667 (vs Jan 2023 $911,952)
Condo Townhouse: $735,688 (vs Jan 2023 $754,180)
Apartment: $724,850 (vs Jan 2023 $584,428)
Hamilton
Average Sale Price: $800,584 compared to $750,529 last month
Average Days on Market: 31.2 days
Detached: $875,388 (vs Jan 2023 $809,019)
Semi: $761,011 (vs Jan 2023 $683,400)
Town/Row: $710,972 (vs Jan 2023 $684,416)
Apartment: $455,698 (vs Jan 2023 $531,397)
Oakville
Average Sale Price: $1,564,949 compared to $1,381,445 last month
Average Days on Market: 22 days
Detached: $1,921,486 (vs Jan 2023 $1,788,271)
Semi: $1,203,188 (vs Jan 2023 $1,063,500)
Freehold Townhouse: $1,219,685 (vs Jan 2023 $1,032,025)
Condo Townhouse: $807,667 (vs Jan 2023 $819,109)
Condo Apartment: $1,158,950 (vs Jan 2023 $975,833)
Mississauga
Average Sale Price: $1,009,803 compared to $920,587 last month
Overall Average Days on Market: 24 days
Detached: $1,543,866 (vs Jan 2023 $1,379,588)
Semi: $1,033,327 (vs Jan 2023 $960,178)
Freehold Townhouse: $1,004,456 (vs Jan 2023 $1,045,429)
Condo Townhouse: $803,277 (vs Jan 2023 $797,702)
Condo Apartment: $612,221 (vs Jan 2023 $626,401)
Toronto West
Average Sale Price: $990,281 compared to $945,803 last month
Average Days on Market: 25 days
Detached: $1,462,662 (vs Jan 2023 $1,333,427)
Semi: $1,079,656 (vs Jan 2023 $1,042,380)
Freehold Townhouse: $1,191,538 (vs Jan 2023 $982,600)
Condo Townhouse: $761,817 (vs Jan 2023 $812,818)
Condo Apartment: $645,913 (vs Jan 2023 $600,323)
Milton
Average Sale Price: $1,055,272 compared to $1,055,208 last month
Average Days on Market: 14 days
Detached: $1,318,244 (vs Jan 2023 $1,314,975)
Semi: $1,013,714 (vs Jan 2023 $929,460)
Freehold Townhouse: $745,714 (vs Jan 2023 $928,605)
Condo Townhouse: $920,802 (vs Jan 2023 $670,000)
Condo Apartment: $624,656 (vs Jan 2023 $650,857)
Sources for Real Estate Market Update for February 2023 : Toronto Regional Real Estate Board and REALTORS® Association of Hamilton-Burlington