
06 Sep Real Estate Market August 2024
Your August 2024 real estate market update is here! Covering Toronto, Oakville, Burlington, Hamilton and the surrounding areas.
Highlights of the real estate market from TREBB and RAHB
Greater Toronto Area home sales were down on a year-over-year basis in August 2024. New listings were up slightly over the same period. While the region’s housing market remained well-supplied in August, average home prices only edged slightly lower compared to August 2023.
GTA REALTORS® reported 4,975 home sales through TRREB’s MLS® System in August 2024 – down by 5.3% compared to 5,251 sales reported in August 2023. New listings entered into the MLS® System amounted to 12,547 – up by 1.5% year-over-year. On a seasonally adjusted basis, August sales edged up on a monthly basis compared to July, whereas new listings were down slightly compared to the previous month.
The MLS® Home Price Index Composite benchmark was down by 4.6% year-over-year in August 2024. The average selling price was down by a lesser 0.8% compared to August 2023 to $1,074,425. The different annual rates of change between the MLS® HPI Composite and the average selling price were largely due to an increase in the share of detached home sales compared to last year, impacting the average price. On a seasonally adjusted basis, the average selling price edged lower compared to July.
“As borrowing costs trend lower over the next year-and-a-half, home buyers will initially benefit from both lower monthly mortgage payments and lower home prices. Even as demand picks up, especially in 2025, it will take time for the inventory of listings to be absorbed. Ample choice in the market will help keep price growth moderate, at least in the initial phases of recovery,” said TRREB Chief Market Analyst Jason Mercer.
Over in the Hamilton-Burlington area, the real estate market maintains recent trends, as sales continue to slow and inventory levels rise. August sales slowed to 690 units, contributing to the year-to-date decline of7%. When we compare the market to long-term trends, sales are down across all areas. Burlington continues to report the tightest market conditions in the region.
“There is more inventory than we have seen in recent years, which provides prospective buyers with flexibility and choice. We are seeing many hopeful buyers continue to wait for interest rates to come down as they are predicted to do. Now is a good time for buyers to take advantage of the increased opportunities. When interest rates come down, there could once again be a strain on inventory,” says Nicolas von Bredow, Cornerstone spokesperson for the Hamilton-Burlington market area.
New listings have remained relatively consistent with long-term trends. However, listings are being met with slower sales, resulting in inventory levels above both last year’s and long-term trends. A surge in inventory relative to sales has caused the months of supply to rise to four and a half months, reflecting the highest level seen for August since 2010. Higher inventory levels compared to sales have placed downward pressure on home prices.
In August, the unadjusted benchmark price stood at $840,300, down over last month and over 2% cent below last year’s levels. The steepest price decline is occurring in the oversupplied apartment condominium sector.
Questions about buying or selling? Reach out anytime, I’d be happy to discuss the market with you!
All the latest home prices and statistics by property type and city below!
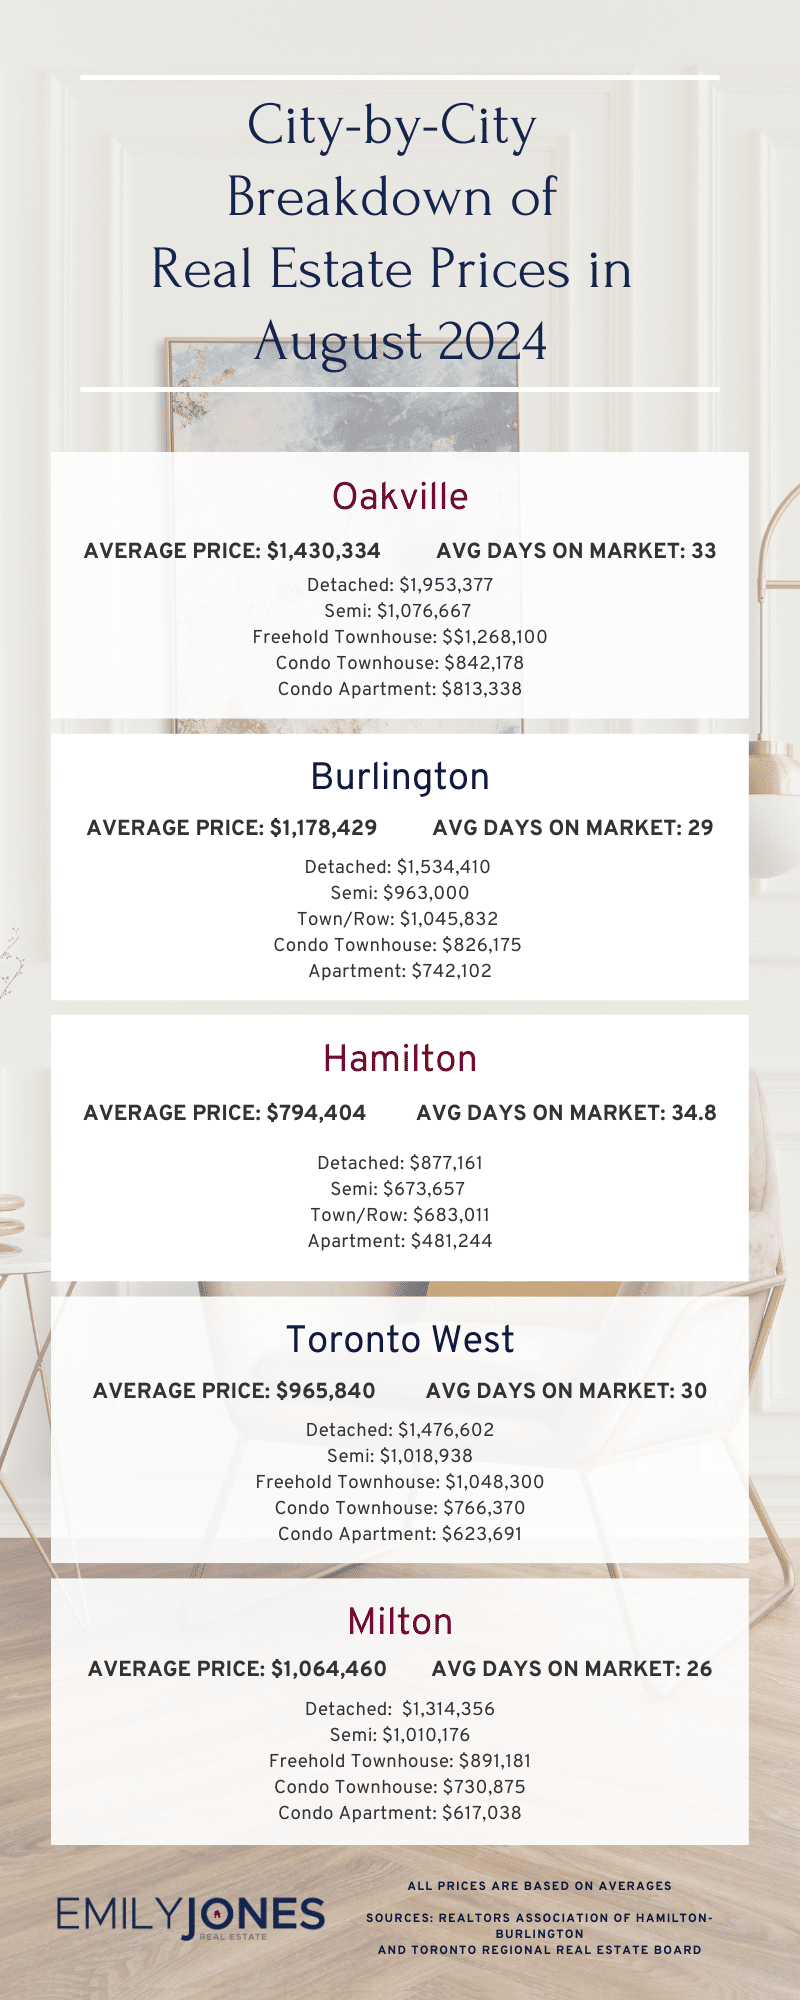
Burlington
Average Sale Price: $1,178,429 compared to $1,126,610 last month
Average Days on Market: 29 days
Detached: $1,534,410 (vs July 2024 $1,506,433)
Semi: $963,000 (vs July 2024 $945,714)
Town/Row: $1,045,832 (vs July 2024 $981,456)
Condo Townhouse: $826,175 (vs July 2024 $789,932)
Apartment: $742,102 (vs July 2024 $738,332)
Hamilton
Average Sale Price: $794,404 compared to $785,971 last month
Average Days on Market: 34.8 days
Detached: $877,161 (vs July 2024 $873,327)
Semi: $673,657 (vs July 2024 $687,784)
Town/Row: $683,011 (vs July 2024 $677,191)
Apartment: $481,244 (vs July 2024 $431,128)
Oakville
Average Sale Price: $1,430,334 compared to $1,477,883 last month
Average Days on Market: 33 days
Detached: $1,953,377 (vs July 2024 $2,012,349)
Semi: $1,076,667 (vs July 2024 $1,053,750)
Freehold Townhouse: $1,268,100 (vs July 2024 $1,247,974)
Condo Townhouse: $842,178 (vs July 2024 $768,868)
Condo Apartment: $813,338 (vs July 2024 $862,264)
Mississauga
Average Sale Price: $1,044,543 compared to $1,042,868 last month
Overall Average Days on Market: 29 days
Detached: $1,553,878 (vs July 2024 $1,589,373)
Semi: $1,004,502 (vs July 2024 $986,872)
Freehold Townhouse: $1,002,571 (vs July 2024 $1,017,667)
Condo Townhouse: $773,610 (vs July 2024 $799,271)
Condo Apartment: $606,523 (vs July 2024 $631,810)
Toronto West
Average Sale Price: $965,840 compared to $1,029,036 last month
Average Days on Market: 30 days
Detached: $1,476,602 (vs July 2024 $1,457,154)
Semi: $1,018,938 (vs July 2024 $1,087,287)
Freehold Townhouse: $1,048,300 (vs July 2024 $1,042,825)
Condo Townhouse: $766,370 (vs July 2024 $776,049)
Condo Apartment: $623,691 (vs July 2024 $679,633)
Milton
Average Sale Price: $1,064,460 compared to $1,090,062 last month
Average Days on Market: 26 days
Detached: $1,314,356 (vs July 2024 $1,323,960)
Semi: $1,010,176 (vs July 2024 $1,046,050)
Freehold Townhouse: $891,181 (vs July 2024 $889,081)
Condo Townhouse: $730,875 (vs July 2024 $685,000)
Condo Apartment: $617,038 (vs July 2024 $571,111)
Sources for Real Estate Market Update for August 2024 : Toronto Regional Real Estate Board and REALTORS® Association of Hamilton-Burlington