10 Sep Real Estate Market August 2023
Your August 2023 real estate market update is here! Covering Toronto, Oakville, Burlington, Hamilton and the surrounding areas.
Highlights of the real estate market from TREBB and RAHB
Higher borrowing costs, continued uncertainty about the economy and Bank of Canada decision making, and the constrained supply of listings resulted in fewer home sales in August 2023 compared to August 2022. The average selling price remained virtually unchanged over the same period. On a seasonally adjusted monthly basis, sales and average price edged lower.
“Looking forward, we know there will be solid demand for housing – both ownership and rental – in the Greater Toronto Area and broader Greater Golden Horseshoe. Record immigration levels alone will assure this. In the short term, we will likely continue to see some volatility in terms of sales and home prices, as buyers and sellers wait for more certainty on the direction of borrowing costs and the overall economy,” said TRREB President Paul Baron. Greater Toronto Area REALTORS® reported 5,294 sales in August 2023 – down by 5.2% compared to August 2022. New listings were up by 16.2% year-over-over, providing some relief on the supply front, but year-to-date listings are still down substantially compared to the same period last year. Seasonally adjusted sales were down slightly by 1% month-over-month compared to July 2023, while new listings were up slightly by 1.3% compared to July.
“More balanced market conditions this summer compared to the tighter spring market resulted in selling prices hovering at last year’s levels and dipping slightly compared to July. As interest rates continued to increase in May, after a pause in the winter and early spring, many buyers have had to adjust their offers in order to qualify for higher monthly payments. Not all sellers have chosen to take lower than expected selling prices, resulting in fewer sales,” said TRREB Chief Market Analyst Jason Mercer.
The MLS® Home Price Index Composite benchmark for August 2023 was up by 2.5% year-over-year. The average selling price was also up, but by less than 1% to $1,082,496 over the same timeframe. On a month-over-month seasonally adjusted basis, the MLS® HPI Composite benchmark was virtually unchanged and the average price edged lower by 1.6%.
Over in Hamilton, the REALTORS® Association of Hamilton-Burlington (RAHB) reported 795 sales in August, down 7% compared to last August when we saw 873 sales. The decline represents a year-to-date decline of 11%. While sales have improved in the lower price ranges, they have not offset the declines driven by homes priced above $800,000.
“As expected, higher lending rates continue to impact sales, especially for higher priced properties. But new listings have also slowed, keeping inventories in line with long-term trends. While conditions vary by location, property type and price range, we are shifting away from the overall tighter conditions experienced during the spring months,” says RAHB President Nicolas von Bredow.
Easing sales combined with relatively stable inventory levels caused the months of inventory to trend up to 2.9 months in August. Higher supply levels relative to sales activity likely weighed on home prices this month. In August, the benchmark price eased over levels reported last month, falling to $863,700, approximately $10,000 less than the previous month but still higher than the $857,900 reported in August 2022.
Questions about buying or selling? Reach out anytime, I’d be happy to discuss the market with you!
All the latest home prices and statistics by property type and city below!
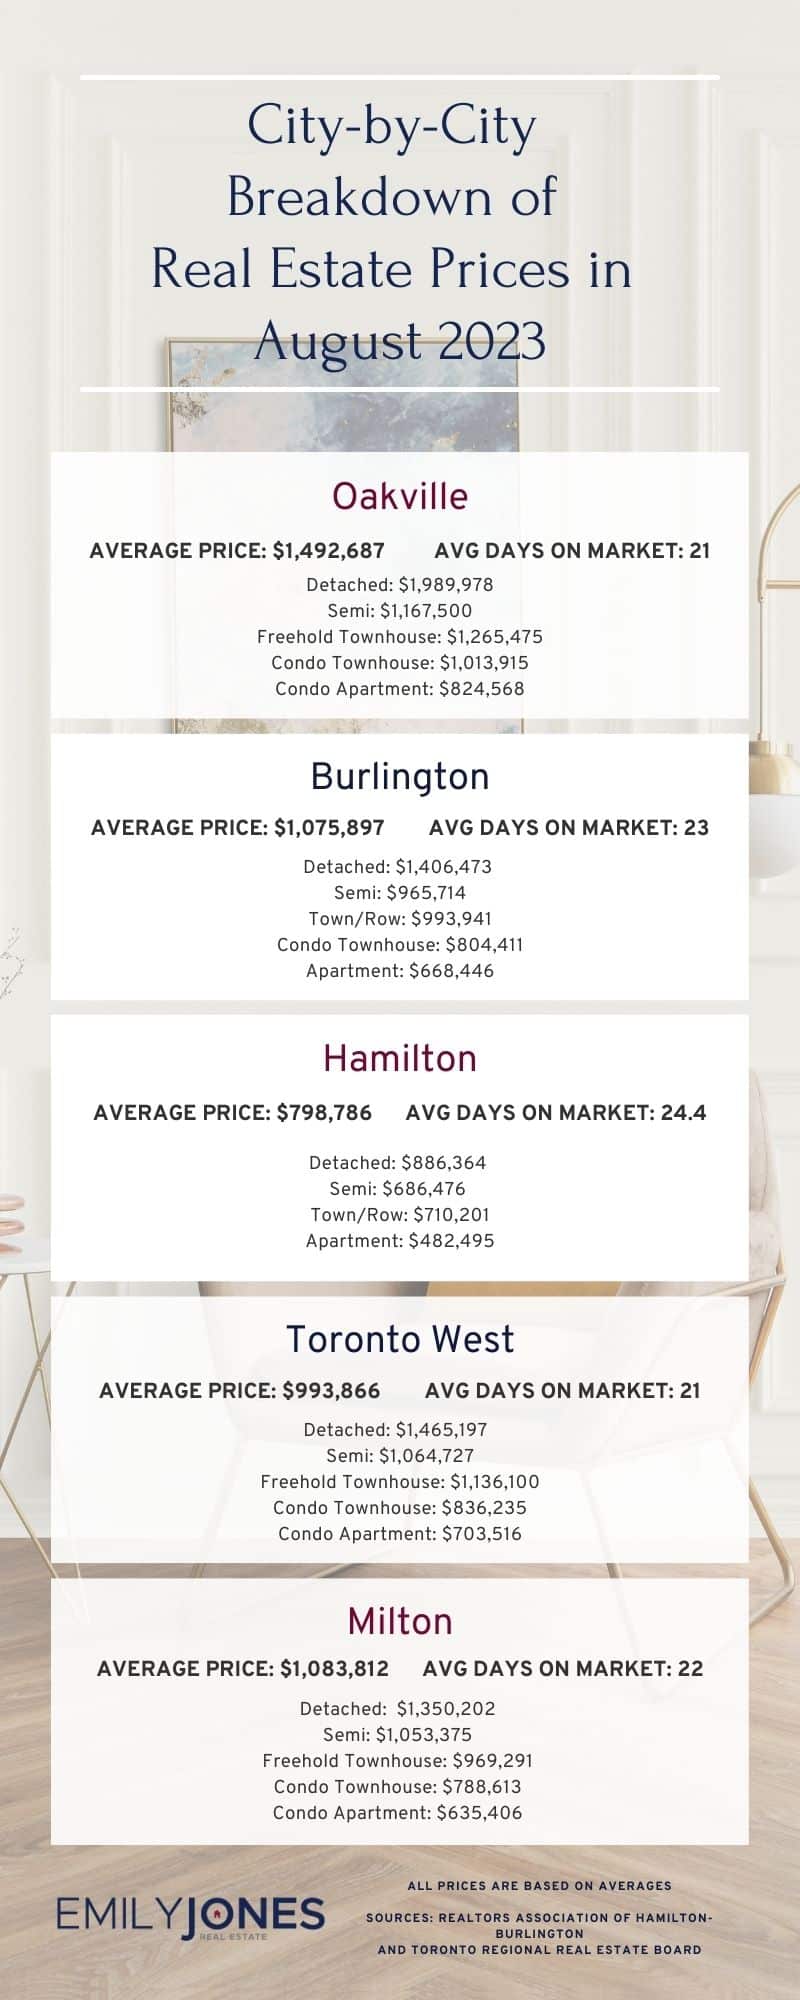
Burlington
Average Sale Price: $1,075,897 compared to $1,166,119 last month
Average Days on Market: 23 days
Detached: $1,406,473 (vs July 2023 $1,531,687)
Semi: $965,714 (vs July 2023 $1,045,607)
Town/Row: $993,941 (vs July 2023 $1,016,531)
Condo Townhouse: $804,411 (vs July 2023 $841,222)
Apartment: $668,446 (vs July 2023 $716,810)
Hamilton
Average Sale Price: $798,786 compared to $847,087 last month
Average Days on Market: 24.2 days
Detached: $886,364 (vs July 2023 $942,008)
Semi: $686,476 (vs. July $732,926)
Town/Row: $710,201 (vs July 2023 $705,697)
Apartment: $482,495 (vs July 2023 $493,015)
Oakville
Average Sale Price: $1,492,687 compared to $1,528,833 last month
Average Days on Market: 21 days
Detached: $1,989,978 (vs July 2023 $2,101,237)
Semi: $1,167,500 (vs July 2023 $1,131,000)
Freehold Townhouse: $1,265,475 (vs July 2023 $1,172,333)
Condo Townhouse: $1,013,915 (vs July 2023 $1,128,923)
Condo Apartment: $824,568 (vs July 2023 $823,263)
Mississauga
Average Sale Price: $1,057,232 compared to $1,057,640 last month
Overall Average Days on Market: 20 days
Detached: $1,563,717(vs July 2023 $1,530,510)
Semi: $1,046,247 (vs July 2023 $1,057,125)
Freehold Townhouse: $956,770 (vs July 2023 $1,061,618)
Condo Townhouse: $855,061 (vs July 2023 $806,425)
Condo Apartment: $629,894 (vs July 2023 $676,903)
Toronto West
Average Sale Price: $993,866 compared to $1,043,412 last month
Average Days on Market: 21 days
Detached: $1,465,197 (vs July 2023 $1,483,704)
Semi: $1,064,727 (vs July 2023 $1,096,655)
Freehold Townhouse: $1,136,100 (vs July 2023 $1,127,961)
Condo Townhouse: $836,235 (vs July 2023 $971,771)
Condo Apartment: $703,516 (vs July 2023 $675,911)
Milton
Average Sale Price: $1,083,812 compared to $1,079,477 last month
Average Days on Market: 22 days
Detached: $1,350,202 (vs July 2023 $1,303,096)
Semi: $1,053,375 (vs July 2023 $1,011,818)
Freehold Townhouse: $969,291 (vs July 2023 $918,692)
Condo Townhouse: $788,613 (vs July 2023 $779,444)
Condo Apartment: $635,406 (vs July 2023 $667,688)
Sources for Real Estate Market Update for August 2023 : Toronto Regional Real Estate Board and REALTORS® Association of Hamilton-Burlington