18 May Real Estate Market April 2023
Your April 2023 real estate market update is here! Covering Toronto, Oakville, Burlington, Hamilton and the surrounding areas.
Highlights of the real estate market from TREBB and RAHB
The Greater Toronto Area (GTA) housing market continued to tighten in April 2023. On a year-over-year basis, sales edged lower compared to April 2022, but new listings were down by more than one-third. Fewer listings relative to sales meant there was more competition between buyers, supporting an improvement in selling prices since the beginning of this year.
GTA REALTORS® reported 7,531 sales through TRREB’s MLS® System in April 2023 – down by 5.2% compared to April 2022. In comparison to March 2023, sales increased on an actual and seasonally adjusted basis. On a year-over-year basis, new listings were down by 38.3/5 in April 2023.
The MLS® Home Price Index (HPI) Composite Benchmark was down by 12.1% year-over-year in April 2023. Compared to March, the benchmark price was up on an actual and seasonally adjusted basis. The average selling price in the GTA was $1,153,269 in April 2023 – down 7.8% compared to $1,250,704 in April 2022. The average selling price also increased compared to March, both on an actual and seasonally adjusted basis.
“As demand for ownership housing has picked up relative to supply, we are seeing renewed upward pressure on home prices. For a short period of time, higher borrowing costs trumped the impact of the constrained housing supply in the GTA. Renewed competition between buyers is once again shining the spotlight on the persistent lack of listings and resulting impact on affordability,” said TRREB Chief Market Analyst Jason Mercer.
Over in Hamilton,
Over in the Hamilton-Burlington area, the REALTORS® Association of Hamilton-Burlington (RAHB) reported 1,071 sales and 1,527 new listings in April. This marks the first time since early 2022 that the sales-to-new listings ratio pushed above 70%. The increase in sales placed a strain on the pace of inventory growth, causing supply levels to trend down compared to last month. There were 1.6 months of supply available in April, and while this is a marked increase over peak pandemic levels, it is significantly less than the over three months of supply reported throughout most of the latter half of 2022.
“The gains in lending rates impacted sales across the RAHB market area, but we also saw a shift come from existing homeowners who were also reluctant to sell their home,” says Nicolas von Bredow, RAHB President. “In April, new listings coming onto the market were much lower than levels traditionally seen at this time of year, keeping inventories relatively low in our market, and placing upward pressure on home prices.”
Low supply and increased sales are supporting an upward shift in prices in the region. In April, the unadjusted benchmark price reached $868,800, reflecting the fourth consecutive month prices have increased. Prices are still below the unprecedented highs seen during the peak in 2022, but provide some reassurance as to where prices will stabilize.
Questions about buying or selling? Reach out anytime, I’d be happy to discuss the market with you!
All the latest home prices and statistics by property type and city below!
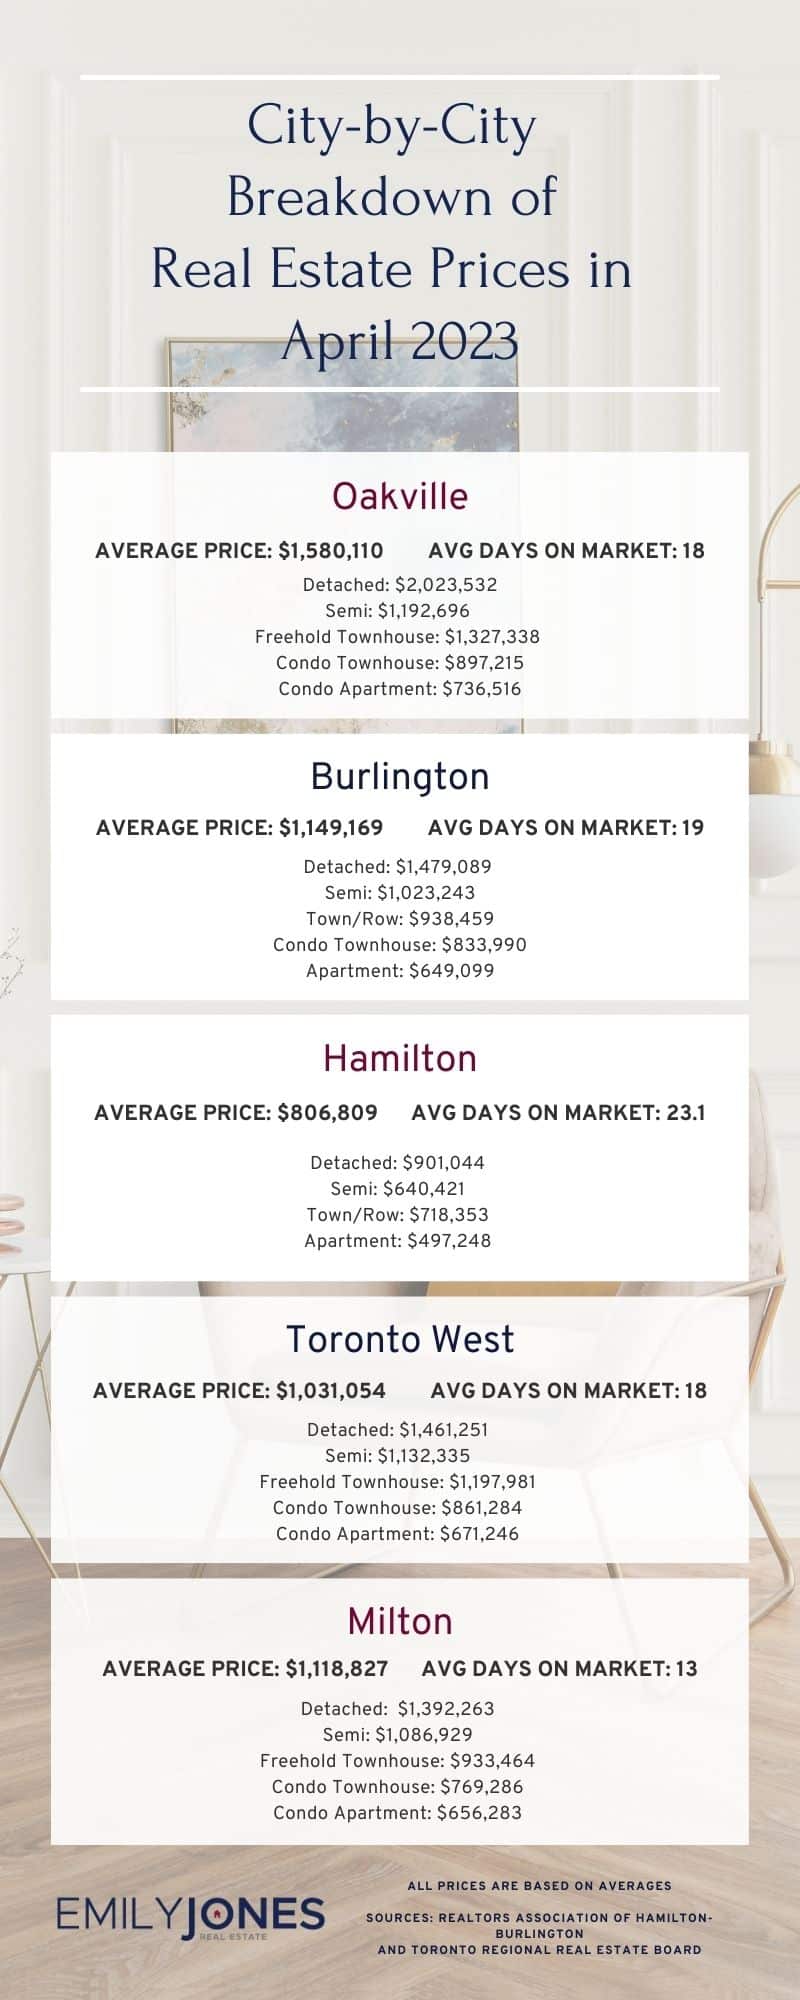
Burlington
Average Sale Price: $1,149,169 compared to $1,040,336 last month
Average Days on Market: 19 days
Detached: $1,479,089 (vs Mar 2023 $1,431,359)
Semi: $1,023,243 (vs Mar 2023 $992,143)
Town/Row: $938,459 (vs Mar 2023 $948,187)
Condo Townhouse: $833,990 (vs Mar 2023 $826,863)
Apartment: $649,099 (vs Mar 2023 $581,910)
Hamilton
Average Sale Price: $806,809 compared to $793,241 last month
Average Days on Market: 23.1 days
Detached: $901,044 (vs Mar 2023 $871,682)
Semi: $640,421 (vs Mar 2023 $642,370)
Town/Row: $718,353 (vs Mar 2023 $727,205)
Apartment: $497,248 (vs Mar 2023 $458,465)
Oakville
Average Sale Price: $1,580,110 compared to $1,571,254 last month
Average Days on Market: 18 days
Detached: $2,023,532 (vs Mar 2023 $2,046,817)
Semi: $1,192,696 (vs Mar 2023 $1,179,525)
Freehold Townhouse: $1,327,338 (vs Mar 2023 $1,153,193)
Condo Townhouse: $897,215 (vs Mar 2023 $821,668)
Condo Apartment: $736,516 (vs Mar 2023 $811,418)
Mississauga
Average Sale Price: $1,076,430 compared to $1,009,803 last month
Overall Average Days on Market: 17 days
Detached: $1,567,031 (vs Mar 2023 $1,553,304)
Semi: $1,059,454 (vs Mar 2023 $1,057,053)
Freehold Townhouse: $1,071,606 (vs Mar 2023 $1,074,467)
Condo Townhouse: $857,062 (vs Mar 2023 $828,182)
Condo Apartment: $655,660 (vs Mar 2023 $614,758)
Toronto West
Average Sale Price: $1,031,054 compared to $984,046 last month
Average Days on Market: 18 days
Detached: $1,461,251 (vs Mar 2023 $1,394,880)
Semi: $1,132,335 (vs Mar 2023 $1,119,345)
Freehold Townhouse: $1,197,981 (vs Mar 2023 $1,228,167)
Condo Townhouse: $861,284 (vs Mar 2023 $758,409)
Condo Apartment: $671,246 (vs Mar 2023 $650,286)
Milton
Average Sale Price: $1,118,827 compared to $1,133,210 last month
Average Days on Market: 13 days
Detached: $1,392,263 (vs Mar 2023 $1,411,213)
Semi: $1,086,929 (vs Mar 2023 $1,007,783)
Freehold Townhouse: $933,464 (vs Mar 2023 $945,494)
Condo Townhouse: $769,286 (vs Mar 2023 $781,667)
Condo Apartment: $656,283 (vs Mar 2023 $666,738)
Sources for Real Estate Market Update for April 2023 : Toronto Regional Real Estate Board and REALTORS® Association of Hamilton-Burlington