
02 Apr HAMILTON BURLINGTON REAL ESTATE March 2018
HAMILTON BURLINGTON REAL ESTATE UPDATE – March 2018
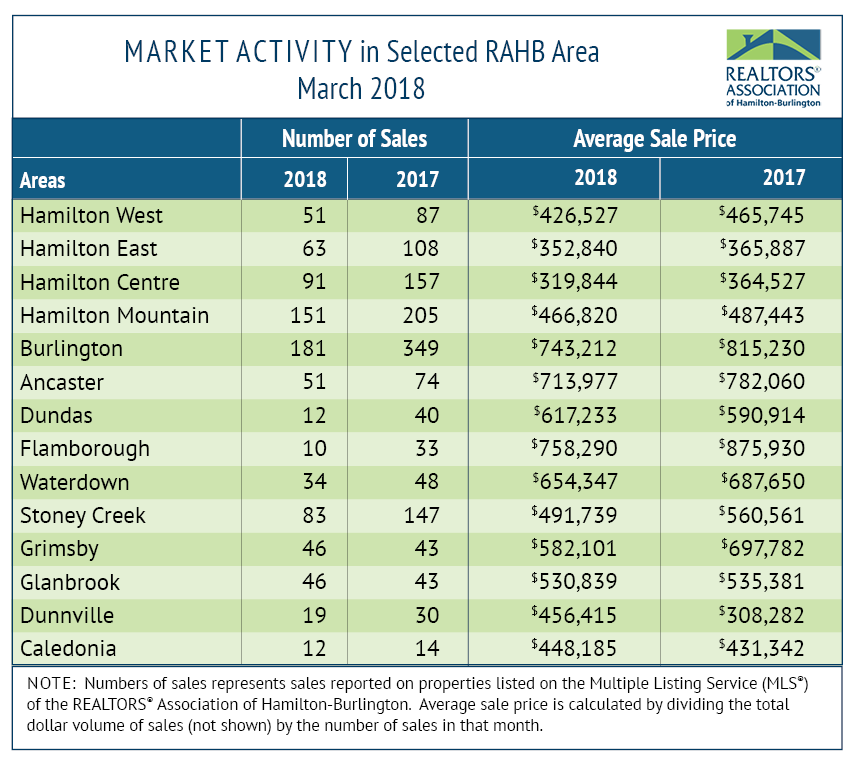
A LOOK AT THE MARCH MARKET
THE March 2018 REAL ESTATE MARKET UPDATE AND STATISTICS FOR HAMILTON AND BURLINGTON ARE HERE! LOOKING FOR MORE INFORMATION OR ANOTHER COMMUNITY? CONTACT ME FOR MORE.
The REALTORS® Association of Hamilton-Burlington (RAHB) reported 1,099 sales were processed through the RAHB Multiple Listing Service® (MLS®)System in March, 38.6 percent fewer than the same month last year and 18 percent fewer than the 10-year average for the month.
All property listings were 13.5 percent lower than the same month last year and 8.1 percent lower than the 10-year average.
“Our area experienced similar cooling off as is being reported by other real estate markets in the Golden Horseshoe area,” said RAHB CEO George O’Neill. “Local sales were lower not only compared to March of last year, but also compared to the 10-year average for March.”
Seasonally adjusted* sales of residential properties were 34 percent lower than March 2017. The average sale price down 8.6 percent for the month. Seasonally adjusted numbers of new listings were 3.2 percent lower than March of 2017.
Median and Average Prices
Overall residential sales of 1,050 units were 37.8 percent lower than March last year. Residential freehold sales were 38.4 percent lower than the same month last year. Sales in the condominium market were 35.5 percent lower.
The median price of freehold properties decreased by 8.2 percent over the same month of the previous year. The median price for condominium properties increased by almost one percent compared to the same period.
The average price of freehold properties declined by 15.5 percent from March 2017. The average sale price in the condominium market decreased by 1.6 percent compared to the same period.
Average sale price is based on the total dollar volume of all properties sold through the RAHB MLS® System. Average sale price can help establish long-term trends, but shouldn’t be used as an indicator that a specific property value has increased or decreased. Contact a local REALTOR® for information about your specific neighbourhood or property.
“This is the first time in awhile that we’ve seen the average sale price lower than the same month the previous year for both freehold and condominium properties,” added O’Neill. “The condominium market is experiencing less of a drop – not even two percent – and in fact, the median sale price is still almost one percent above where it was last year.”
Days on Market
The average number of days on market rose to 26 days from 17 days in the freehold market. In the condominium market, this increased to 29 days from 19 days compared to the same month last year.
“For the general downward trend in the numbers comparing March 2018 to March of 2017, we have to keep sight of the bigger picture,” noted O’Neill. “The sales-to-new-listings ratio is still at 60 per cent for the residential market,which is generally considered the line between a balanced market and a seller’s market. In addition, the average days on market is at a comfortable level,providing buyers and sellers time to make informed decisions.”
Every community in RAHB’s area has its own localized characteristics that influence that market. Please ensure you contact a local RAHB REALTOR® for professional advice.
March 2018 Real Estate Update Source: Realtors Association of Hamilton-Burlington